Cosmetic Dental SEO Sydney: 27% Organic Growth Case Study
A cosmetic and general dental practice in Pyrmont, inner Sydney, had built 20 years of clinical reputation delivering veneers, dental implants, and Invisalign across multiple locations yet organic search visibility had stalled between 700 and 940 sessions per month. That cosmetic dental practice approached Premium SEO Firm with 3 confirmed problems: primary Pyrmont-targeting keywords sitting between positions 4 and 7, keyword cannibalization across dozens of pages fragmenting ranking authority, and organic visibility that did not reflect two decades of established market presence. This cosmetic dental SEO case study documents what we found, what we built, and how the site navigated 5 major Google algorithm updates to deliver 27% year-on-year organic growth by February 2026
Despite 20 years of clinical excellence in veneers, implants, and Invisalign, this Pyrmont dental practice’s organic traffic was capped between 700 and 940 sessions per month, with primary Pyrmont-targeting keywords trapped between positions 4 and 7.
What Market Conditions, Technical Deficits, and Structural Problems Did This Practice Face at Campaign Launch?
3 distinct structural problems defined the starting position: insufficient first-page ranking consolidation on primary Pyrmont keywords, a competitive local search market with 3 simultaneous competitor categories, and keyword cannibalization across dozens of pages distributing authority rather than concentrating it. Resolving all 3 required a sequenced 18-month strategy rather than a single-phase fix.
3 simultaneous structural problems defined this cosmetic dental practice’s ranking ceiling: fierce 3-tier competition from group practices, CBD chains, and suburb-adjacent clinics; severe keyword cannibalization fragmenting page authority; and the expanding AI search features progressively absorbing informational clicks.
Why Does the Inner-Sydney Dental Search Market Produce Unusually Competitive Ranking Conditions?
Inner-city Sydney dental practices compete against 3 distinct competitor categories simultaneously: large multi-chair group practices, corporate dental chains with dedicated SEO budgets, and Sydney CBD-anchored practices whose geographic authority extends across adjacent suburbs including Pyrmont. Pyrmont sits inside one of the most contested local search markets in Australia. For a practice dependent on local patients arriving via organic search at high booking intent, ranking between positions 4 and 7 versus positions 1 through 3 produces a directly measurable reduction in qualified traffic volume.
What Did the Baseline Data Confirm When the Campaign Began in September 2024?
Google Search Console (GSC) data at campaign launch confirmed organic sessions running between 700 and 940 per month, with primary Pyrmont-targeting keywords sitting between positions 4 and 7 in Google search results. GSC is Google’s free platform that reports how a site performs in Google search, including which pages receive clicks, how many times they appear in results, and their average ranking position.
Location-specific keywords targeting surrounding suburbs held strong first-position rankings, establishing that the site carried genuine authority in those geographic areas. Primary Pyrmont-targeting keywords are the terms a booking-intent patient in Pyrmont types at the moment of decision. Those keywords sat at positions 4 through 7. The gap between position 3 and position 7 for a high-intent local dental search represents the difference between appearing in the 3-result consideration set and appearing below it.
What Structural Problem Was Suppressing Keyword Consolidation Across the Site?
Keyword cannibalization across dozens of pages was the primary structural deficit causing Google to distribute ranking authority rather than consolidate it behind a single strongest candidate. Keyword cannibalization is a condition in which multiple pages on a website compete simultaneously for the same keyword.
The site had accumulated treatment pages, blog articles, and location content over several years without a coordinated keyword architecture. The result was that competing pages prevented any single page from reaching its maximum achievable ranking position for target keywords. Resolving cannibalization across each affected keyword cluster required methodical, ongoing execution throughout the 18-month campaign.
The search environment itself was shifting. Google progressively expanded AI-powered search features within Australian results throughout 2025. Multiple significant core updates rolled through the market in parallel during this period. Campaigns active during 2025 operated against both of these forces simultaneously, and our strategic approach accounted for both from the outset.
What Strategy, Technical Work, and Content Architecture Did We Deploy Across 18 Months?
We deployed 5 primary work streams in sequence: a full technical SEO audit, systematic keyword cannibalization resolution across 3 primary treatment areas, on-page optimisation using content scoring tools, a consistent monthly content publishing schedule of 3 articles per month, and a managed off-page link profile programme combining citation building with toxic backlink disavowal.
The audit used 3 enterprise-grade SEO analysis platforms: Ahrefs (Ahrefs Pte. Ltd.), SiteChecker Pro, and Screaming Frog (Screaming Frog Ltd.). Screaming Frog is a crawler tool that examines every page of a website the same way a search engine does, surfacing technical errors that suppress ranking performance. All work followed white hat SEO practices exclusively. We do not use tactics that create short-term gains at the risk of long-term penalties. Every structural decision was designed to sustain and compound over time.
Page 1 rankings for this Pyrmont cosmetic dental practice were built on 5 work streams deployed below the surface: a full technical SEO audit using Ahrefs, SiteChecker Pro, and Screaming Frog; systematic cannibalization resolution; Surfer SEO on-page optimisation; a consistent E-E-A-T content engine publishing 3 articles monthly; and sustained link protection through citation building and toxic backlink disavowal.
What Technical SEO Fixes Did the Audit Produce and Why Did Each Category Matter?
Page-Level Fixes: Titles, Meta Descriptions, Heading Structure, and Image Optimisation
Our technical audit identified and resolved issues across 6 page-element categories: page title length (28 pages corrected), meta description specification (11 high-priority pages corrected), H1 heading conflicts (2 pages resolved), oversized image file sizes (17 images optimised below 100 kilobytes), missing image alt text (1 instance resolved), and mixed HTTP/HTTPS internal link errors resolved across affected pages.
Each category corresponds to a distinct signal Google evaluates during crawling and indexation. Page titles truncated by Google reduce click-through rate (CTR) from search results. CTR is the percentage of users who click on a result after seeing it. Oversized images degrade page loading speed, a confirmed Core Web Vitals signal. Core Web Vitals are Google’s 3-metric framework measuring real-user page experience, introduced as a confirmed ranking signal in June 2021. Mixed HTTP/HTTPS internal links cause Google to treat the same destination as 2 separate addresses, fragmenting the link equity flowing to that page.
Redirect chains received targeted resolution during the same audit phase. A redirect chain is a sequence of multiple redirects between an origin URL and its final destination. Each redirect step causes a measurable loss of PageRank flowing through that path. PageRank is the authority value Google assigns to pages based on the quality and quantity of links pointing to them. Clearing redirect chains restored direct link equity paths to the pages those chains had reached.
Platform-Level Updates: WordPress, PHP, CSS, and JavaScript Optimisation
WordPress core, theme, plugin, and PHP version updates ran on a regular schedule throughout the 18-month campaign, maintaining platform security and compatibility with Google’s rendering infrastructure. CSS and JavaScript files received deferral and minification treatment. Deferral delays the loading of non-critical code until the page’s primary visual content has already loaded, reducing time-to-interaction for visitors and improving INP performance. INP, or Interaction to Next Paint, is the third Core Web Vitals metric.
INP measures the delay between a user’s first interaction with a page and the browser’s next visual response. Google’s ‘Good’ threshold for INP is under 200 milliseconds, a standard that replaced the previous FID (First Input Delay) metric in March 2024. Removal of unnecessary Google Fonts loading eliminated extra network requests that previously added latency to every page load without contributing visible improvement to the visitor experience.
SiteChecker Pro monitoring throughout the campaign identified and addressed header security configurations, image dimension attributes, internal linking gaps, and canonical tag accuracy. A canonical tag is an HTML element using the rel=”canonical” attribute that signals to Google which version of a URL is the preferred destination when similar content exists at multiple web addresses. Canonical tag accuracy determines which pages accumulate ranking authority and which Google treats as secondary.
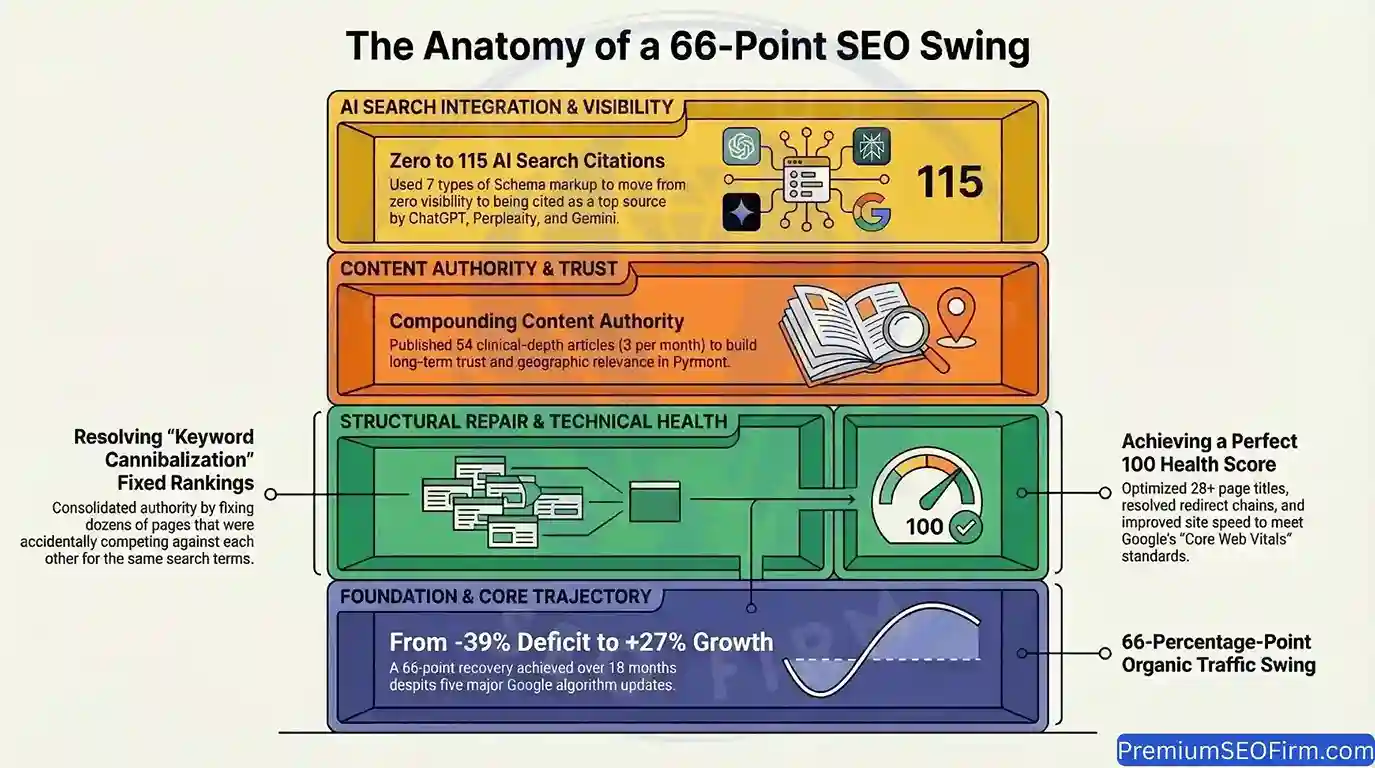
The technical SEO programme delivered a perfect 100/100 health score on both Ahrefs and SiteChecker Pro by July 2025, achieved through correcting 28 page titles, optimising 17 oversized images, clearing redirect chains, and deferring CSS and JavaScript to meet Google’s sub-200ms INP threshold.
How Did Keyword Cannibalization Resolution Produce the Campaign’s Largest Structural Improvement?
Identifying and Resolving the Dental Implants Cannibalization Cluster
Our cannibalization analysis identified 7 pages simultaneously sending competing keyword signals for the dental implants treatment page: the homepage, the all-on-4 page, the about page, the cosmetic dentistry hub, the smile gallery, and 2 additional informational pages.
Each of these pages carried copy, image alt text, or meta fields containing the target keyword phrase. This caused Google Search Console to surface multiple URLs when the dedicated treatment page should have been the sole ranking candidate. The resolution process involved updating homepage copy to replace direct keyword mentions with semantically related alternative phrasing, correcting image alt text across all 7 affected pages, updating the about page meta title and description, removing competing keyword mentions from the cosmetic dentistry hub, and building internal links from all affected pages to the dedicated dental implants treatment page using keyword-matched anchor text.
7 pages simultaneously sending competing keyword signals for the dental implants treatment page were identified and resolved through anchor text audits, competing mention removal, meta field correction, and targeted internal linking — concentrating all authority into a single hyper-authoritative master page.
Applying the Same Resolution Process to Cosmetic Dentistry and Orthodontics Pages
We applied the same 5-step cannibalization resolution process to the cosmetic dentistry treatment page and the orthodontics treatment page in subsequent months. The 5 steps were: anchor text audit, internal link addition, competing mention removal, meta field correction, and Search Console monitoring.
One suburb page received a data-nosnippet tag on a specific section to prevent that section from contributing a competing snippet to search results. A data-nosnippet tag is an HTML attribute that tells Google not to use a tagged section of a page as a search result snippet. Cannibalization resolution is not a one-time event.
New content published to a site creates new potential conflicts. Monthly cannibalization checks ran throughout the entire 18-month campaign, using Google Search Console data to identify any URL newly surfacing for a target keyword and correcting the conflict before it reduced the target page’s ranking position.
How Did On-Page Optimisation and Schema Implementation Strengthen Commercial Page Performance?
Homepage Content Score Progression from 56 to 74 in Surfer SEO
Surfer SEO is an on-page optimisation tool that analyses a target page against the highest-ranking competitors for a given keyword, identifying the specific semantic terms, topic coverage patterns, and structural elements those competitors include that the target page does not. Our Surfer SEO homepage content score for the primary local keyword rose from 56 at campaign launch to 74 by May 2025, a 32% improvement across 4 optimisation rounds.
We achieved this by adding geo-modified location mentions, incorporating semantically related terms, expanding FAQ sections, and embedding trust signals including a reference to 20-plus years of clinical experience.
Period
Surfer SEO Homepage Score
Key Changes Made
January 2025
56
Baseline at campaign start
February 2025
63
Added geo mentions, semantic terms, local references
May 2025 (round 1)
69
Further semantic terms and internal linking structure
The table above shows that the score improvement was not achieved in a single round. Each optimisation pass addressed a different layer of the competitive gap. The final round combined cannibalization fixes with semantic refinement, producing the largest single-round score movement of the 4 rounds.
Schema Markup Implementation Across All Major Pages
We implemented 7 schema types across the homepage and all primary treatment pages: Dentist schema, Service schema, FAQPage schema, WebPage schema, LocalBusiness schema, AggregateRating schema, and ImageObject schema. Schema markup is structured data code added to a page in JSON-LD (JavaScript Object Notation for Linked Data) format. JSON-LD is the structured data format recommended by Google for communicating entity type, attributes, and relationships directly to search engines and AI platforms.
Each schema type provides a distinct layer of structured context that search engines and AI platforms use to verify entity type, service offerings, geographic relevance, and content format. FAQPage schema allows question-and-answer content to appear in Google search results as an expandable panel, increasing visible real estate on the results page. The schema implementation programme contributed directly to AI platform citation results, which the AI visibility section below addresses in full.
7 schema types were implemented in JSON-LD format across the homepage and all primary treatment pages, communicating entity type, service offerings, and geographic relevance directly to search engines and AI platforms — deployed well before AI search became a mainstream traffic source.
How Did the Monthly Content Strategy Build Topical Authority Over 18 Months?
We published 3 new blog articles per month consistently across the entire 18-month campaign period, producing a total of 54 articles covering 3 strategic topic categories: high-volume informational searches around cosmetic treatments and costs, suburb-specific local topics reinforcing geographic relevance signals, and clinical-depth articles satisfying Google’s E-E-A-T (Experience, Expertise, Authoritativeness, and Trustworthiness) framework.
E-E-A-T is the primary content quality evaluation framework defined in Google’s Search Quality Rater Guidelines (2022, updated 2024), applied with particular weight to health-related content. Google’s Search Quality Rater Guidelines are the standards human evaluators use to assess the quality of search results and the content behind them.
Content published at consistent monthly intervals generates compounding topical authority signals that a single large content batch published once does not. Per Google’s developer documentation on content quality, sites demonstrating sustained topical expertise over time accumulate stronger domain-level quality signals than sites with inconsistent publication patterns.
Each article published across the 18 months was cross-linked into the site’s existing page architecture using geo-modified anchor text. Geo-modified anchor text incorporates location names into the clickable link text, for example “dental team in Pyrmont” rather than “click here”, creating a directional internal link signal from each new article toward the homepage and primary treatment pages.
How Did Off-Page Link Building and Toxic Backlink Removal Protect the Link Profile?
Our off-page programme delivered 2 concurrent activities across 18 months: the addition of 20-plus new citation listings across relevant Australian business directories including suburb-specific listings for each of the practice’s locations, and monthly disavowal batches removing spam links from low-quality external domains through Google’s Disavow Tool. A citation in local SEO is any third-party online mention of a business’s name, address, and phone number. Google Search uses citation volume and consistency to verify that a local business is genuinely established across a geographic area. Suburb-specific citation listings reinforced the geographic relevance signals for each of the practice’s service locations.
The disavow file received monthly additions, removing dozens of domains across the campaign that pointed to the site from link farms and low-quality directories. Google’s Disavow Tool is a mechanism through which site owners inform Google to ignore specific backlinks when evaluating a site’s link profile quality. Monthly disavowal is an ongoing maintenance activity that prevents toxic link proximity from eroding the site’s domain-level quality score over time.
How Was Google Business Profile Management Integrated With the Broader Local SEO Strategy?
We published each of the 3 monthly blog articles to the practice’s Google Business Profile as a post, maintaining continuous activity signals and extending the reach of new content beyond the website itself. Google Business Profile is Google’s local business listing platform, the primary source of information Google uses to populate local search results and Google Maps. Competitor activity across all local keyword categories received monthly monitoring throughout the campaign. The suburb-level targeting strategy, maintaining first-position rankings for subsidiary location terms across multiple Sydney suburbs, contributed measurably to total organic traffic during months when primary Pyrmont keyword positions experienced pressure from algorithm updates.
How Did AI Search Visibility Become a Measurable Traffic Source During This Campaign?
AI platform visibility grew from zero tracked results at campaign start to a peak of 115 results across all platforms in January 2026, with real referral sessions from 3 separate AI platforms recorded simultaneously by February 2026. We tracked AI platform visibility as a formal monthly metric from November 2025. AI platform visibility measures the frequency with which an AI assistant cites the practice’s website when answering patient queries. ChatGPT.com, the AI assistant platform operated by OpenAI, first appeared as a direct referral traffic source in Google Analytics data in May 2025. Perplexity, the AI-powered answer engine, generated its first recorded referral sessions in September 2025. Google Gemini, Google’s AI assistant platform, produced its first referral sessions in January 2026.
The structured data programme, specifically the 7 schema types deployed across every major page, provides the machine-readable entity signals that AI platforms use when evaluating whether a business is credible enough to cite in a generated answer. Content depth, consistent factual accuracy, and broad topical coverage across treatment-related topics further strengthen citation probability across AI platforms. We actively optimise for AI search visibility as part of every campaign we run. AI platforms are now a real and growing source of patient referrals, and the structured data and content depth decisions made from day one of a campaign determine whether a site gets cited in AI-generated answers months later.
How Did Traffic, Rankings, and Year-on-Year Comparisons Move Across Each Month of the Campaign?
The 18-month campaign produced a year-on-year organic traffic trajectory that moved from a −39% deficit in August 2025 to +27% growth in February 2026, a 66-percentage-point swing achieved across a period that included the Google March 2025 Core Update, a second Google Core Update rolling through August and September 2025, the October 8, 2025 Australian launch of Google AI Mode, Google Spam Update activity, and the February 2026 Google Discover Core Update.
Phase 1: What Did Foundation-Building Produce During the First Four Months (September–December 2024)?
The September–December 2024 phase established the technical, cannibalization, and schema foundations against a baseline of 700–940 organic sessions per month. The campaign’s strongest early ranking result came in October 2024, when 3 primary keywords simultaneously reached position 3. Early work focused on the technical audit execution, first-round cannibalization identification across the dental implants, cosmetic dentistry, and orthodontics keyword clusters, and deployment of the initial schema and internal linking architecture. December 2024 organic sessions softened to approximately 522, consistent with the year-end seasonal reduction in non-urgent dental appointment searches that Australian dental practices experience each December.
Keyword
Position at Campaign Start (Sep 2024)
Position by Oct 2024
Position by Dec 2024
Suburb dentist term 1
1
1
1
Suburb dentist term 2
1
1
1
Primary Pyrmont dentist keyword
5
3
4
Dental implants variant
5
3
5
Dental clinic variant
—
3
3
Teeth whitening variant
6
5
6
The October 2024 result confirmed that the technical and cannibalization groundwork was producing measurable ranking movement within the campaign’s first 6 weeks.
All-time organic traffic trend showing the long-term growth trajectory from the site’s earlier years through to February 2026, providing context for the campaign’s performance within the broader history of the site.
What Did January 2025 Produce and Why Did Booking Clicks Reach Their Campaign-High of 50?
January 2025 produced 831 total sessions, 661 organic sessions, 547 new users, and 50 online booking clicks, the campaign’s highest booking click month across all 18 months. Online booking clicks are the clearest available commercial intent signal in Google Analytics data. A visitor clicking the booking button is at the decision stage of the patient journey, not the research stage. Rankings at the opening of January held strongly: suburb terms at position 1, primary Pyrmont keyword between positions 3 and 4. The strong booking click result was driven by the schema implementations and internal linking groundwork completed in Q4 2024.
Metric
January 2025
Context
All Traffic
831
Strong open to 2025
Organic Traffic
661
—
New Users
547
—
Online Booking Clicks
50
Campaign high, never surpassed
Google share of traffic
78.3%
Direct: 18.9%
January 2025: 831 total sessions, 661 organic, 547 new users, 50 online booking clicks — the campaign’s single highest booking month.
What Caused the February 2025 Traffic Dip and Why Did Rankings Remain Unaffected?
February 2025 organic sessions fell 24% month-on-month from 661 to 504, caused by a click reduction from overseas veneers cost content. Overseas veneers cost content is a high-volatility informational category whose traffic volume fluctuates month-to-month with shifting searcher interest patterns. Primary Pyrmont keyword rankings held stable at positions 3 and 4, confirming the dip as content traffic fluctuation rather than a ranking loss. Booking clicks held at 48. The Surfer SEO homepage content score rose from 61 to 63 during February through the addition of targeted semantic keyword mentions.
Metric
February 2025
vs January 2025
All Traffic
672
−19% MoM
Organic Traffic
504
−24% MoM
New Users
419
−23% MoM
Online Booking Clicks
48
−4% MoM
Google share
73.2%
Direct rose to 23.9%
Surfer SEO score (homepage)
61 to 63
Improved during month
February 2025: 672 total sessions, 504 organic. The dip was content traffic volatility, not a ranking loss. Primary Pyrmont rankings remained stable.
How Did March 2025 Produce a 33% Organic Recovery While the Google March 2025 Core Update Was Active?
March 2025 produced 862 all sessions and 669 organic sessions, a 33% month-on-month organic recovery and the Q1 high, driven by Search Console-confirmed click recovery across branded terms and veneers overseas content. Growth from suburb-specific location pages contributed 12–17 additional clicks each during the month. The Google March 2025 Core Update rolled through this period. The internal linking architecture, schema deployments, and cannibalization fixes completed in Q4 2024 and January–February 2025 provided structural stability that prevented the update from producing ranking displacement. The primary Pyrmont keyword held at position 3. Dental implants held at position 3. Teeth whitening reached position 4.
Metric
March 2025
vs February 2025
All Traffic
862
+28% MoM
Organic Traffic
669
+33% MoM — Q1 high
New Users
555
+33% MoM
Online Booking Clicks
38
−21% MoM
Google share
75.4%
Direct: 21.2%
March 2025: 862 all sessions, 669 organic — the strongest recovery month of Q1, up 33% from February.
What Caused the April 2025 Softening and How Did a Meta Description Fix Stop Further Ranking Slippage?
April 2025 all traffic fell 13% month-on-month from 862 to 748 and organic fell 14% from 669 to 575, caused by 2 identifiable factors: decreased clicks across veneers blog keywords as the Google March 2025 Core Update completed its rollout, and a homepage meta description display failure that reduced CTR for pages most dependent on the homepage’s authority signal.
A meta description display failure occurs when a page’s specified meta description does not show correctly in Google search results, reducing the visual quality of the search snippet and therefore the CTR from the results page. We corrected the meta description error immediately upon identification. The corrected version incorporated the primary local keyword explicitly and added emoji anchors for increased visual prominence within search results. Year-on-year the gap was minor at −2% all traffic and −5% organic. The primary Pyrmont keyword held at position 3 throughout the month.
Metric
April 2025
MoM Change
YoY Change
All Traffic
748
−13%
−2% vs Apr 2024 (762)
Organic Traffic
575
−14%
−5% vs Apr 2024 (608)
New Users
471
−15%
—
Online Booking Clicks
36
−5%
—
Google share
74.5%
Direct: 20.4%
—
April 2025: 748 all sessions, 575 organic. Post-core-update softening addressed immediately with meta description fix.
What Made May 2025 the Campaign’s Strongest Collective Ranking Month and When Did ChatGPT.com Traffic First Appear?
May 2025 delivered the strongest collective first-page keyword positions of the entire campaign, with the primary Pyrmont keyword at position 3, while ChatGPT.com generated its first recorded referral sessions in Google Analytics, confirming that structured data and content depth signals were registering with AI platforms. Total sessions were 748 and organic sessions were 572, essentially flat month-on-month.
The homepage Surfer SEO content score rose from 69 to 74 during May through the addition of semantic terms, increased local location mentions, and topical signal reinforcement. Monthly cannibalization checks identified 2 pages carrying competing keyword mentions against the homepage. Both pages received anchor text updates and competing mention removal. Booking clicks recovered to 46, up 28% from April’s 36.
Metric
May 2025
MoM Change
YoY Change
All Traffic
748
0%
−11% vs May 2024 (843)
Organic Traffic
572
−0.5%
−14% vs May 2024 (665)
New Users
478
+1.5%
—
Online Booking Clicks
46
+28% MoM
—
Surfer SEO homepage score
74
Up from 69
—
ChatGPT.com referral traffic
First recorded appearance
—
—
May 2025: 748 all sessions, 572 organic. Strongest collective ranking positions of the campaign. ChatGPT.com referral traffic appears for the first time.
What Did the First Half of 2025 Deliver Across the Six Foundation Months?
The first half of 2025 produced 4,519 all sessions, 3,556 organic sessions, 2,917 new users, and 260 online booking clicks at a monthly average of 43 booking clicks, with all tracked keywords on the first page by June and the Surfer SEO homepage score rising from 56 to 74.
H1 2025 Metric
Total (Jan–Jun 2025)
Monthly Average
All Traffic
4,519
753
Organic Traffic
3,556
593
New Users
2,917
486
Online Booking Clicks
260
43
Google share of all traffic
approx. 75%
—
January to June 2025: 4,519 total sessions, 3,556 organic, 2,917 new users, 260 online booking clicks across the first six months of the campaign.
What Keyword Position Data Distinguished June 2025 as the Campaign’s Strongest Collective First-Page Month?
June 2025 recorded the campaign’s strongest full-keyword first-page performance: 2 suburb terms at position 1, dental implants at position 3, primary Pyrmont dentist keyword at position 3, the dental clinic variant at position 4, and the remaining 2 tracked keywords at positions 6 and 8. Every tracked keyword appeared on the first page simultaneously. Total sessions were 738 and organic sessions were 565, down 1% month-on-month.
The minor traffic softening matched the established seasonal pattern for Australian dental markets. Australian winter begins in June. School holidays, cold and flu season, and the July holiday period reliably reduce non-urgent dental appointment searches annually. Schema work this month included WebPage schema added to the homepage, and LocalBusiness and AggregateRating schemas deployed across the cosmetic dentistry and dental implants treatment pages.
Metric
June 2025
MoM Change
YoY Change
All Traffic
738
−1%
−9% vs Jun 2024 (817)
Organic Traffic
565
−1%
−13% vs Jun 2024 (656)
New Users
447
−6%
—
Online Booking Clicks
48
+4% MoM
—
Google share
74.5%
Direct: 19.9%
—
April 2025: 748 all sessions, 575 organic. Post-core-update softening addressed immediately with meta description fix.
Why Did July 2025 Produce the Sharpest Year-on-Year Gap While the Ahrefs Site Health Score Reached 100?
July 2025 produced 674 all sessions and 521 organic sessions, a −33% year-on-year deficit versus July 2024’s 1,003 all sessions, driven by the Australian winter seasonal trough combining with a Google Core Update active during the month. July 2024 was the highest single month of the prior-year baseline, making the year-on-year comparison the most unflattering of the mid-year period. The primary Pyrmont keyword held at position 4 despite the traffic reduction.
Both suburb terms remained at position 1. The Ahrefs site health score reached 100 following resolution of deferred offscreen image loading issues, image dimension attribute conflicts, duplicate HTML ID conflicts, duplicate H1 issues, and oversized images identified during the month’s technical review. Booking clicks fell to 28, consistent with reduced seasonal demand for non-urgent dental appointments.
Metric
July 2025
MoM Change
YoY Change
All Traffic
674
−9%
−33% vs Jul 2024 (1,003)
Organic Traffic
521
−8%
−34% vs Jul 2024 (785)
New Users
391
−13%
—
Online Booking Clicks
28
−42% MoM
—
Ahrefs health score
100
Up from 95, perfect score reached
—
July 2025: 674 all sessions, 521 organic. Australian winter seasonal trough. Site health score reached 100 on Ahrefs.
What Three Simultaneous Factors Drove the Campaign’s Lowest Month in August 2025?
August 2025 produced the campaign’s lowest month due to 3 simultaneous pressures: the Australian winter seasonal trough suppressing non-urgent dental search volume; a Google Core Update rolling through the health and dental search markets; and the progressive rollout of AI-powered answer features absorbing informational, top-of-funnel clicks.
August 2025 produced 560 all sessions and 442 organic sessions, the campaign’s lowest month, with a −40% year-on-year deficit versus August 2024’s 938 all sessions, caused by 3 simultaneous factors. The first was the continuation of Australian winter seasonality. The second was a Google Core Update actively rolling through the market during the month. The third was the progressive expansion of AI-powered answer features within Google’s Australian search results, which reduced click volume from informational queries about treatment costs that previously converted to organic sessions.
The primary Pyrmont keyword held at position 4 throughout August. The site’s ranking position did not deteriorate. Traffic volume fell because demand for non-urgent dental searches fell seasonally, because the Core Update created broader ranking volatility across the dental and health categories, and because Google’s expanding AI answer features absorbed clicks from informational queries.
Actions we took during August included a targeted cannibalization check, anchor text modification across several pages carrying competing signals, removal of keyword mentions from image alt text, new internal links from relevant pages back to the homepage, addition of a trust signal to the homepage hero section referencing 20-plus years of clinical experience, and implementation of FAQPage schema markup.
Despite the −39% traffic deficit and simultaneous algorithmic pressure, primary Pyrmont-targeting keywords held stable at position 4. The traffic reduction was caused by reduced search demand and AI click absorption, not by ranking loss. Structural discipline meant staying the course rather than making reactive strategy changes.
Metric
August 2025
MoM Change
YoY Change
All Traffic
560
−17%
−40% vs Aug 2024 (938) — widest gap
Organic Traffic
442
−15%, campaign low
−39% vs Aug 2024 (729) — widest gap
New Users
371
−5%
—
Online Booking Clicks
25
−11%, campaign low
—
Google share
76.2%
Direct: 18.3%
—
Organic sessions fell to 442 in August 2025, representing a −39% year-on-year deficit versus August 2024. This was the exact point at which reactive SEO strategies fail — abandoning structural discipline in response to temporary algorithmic and seasonal pressure triggers long-term ranking collapse.
August 2025: Campaign low point. 560 all sessions, 442 organic. Three simultaneous pressures: Australian winter seasonality, Google Core Update, and the progressive expansion of AI features in Google’s Australian search results.
How Did September 2025 Deliver a 24% Organic Recovery and Introduce Perplexity as a Second AI Referral Source?
September 2025 produced 699 all sessions and 546 organic sessions, a 25% and 24% month-on-month recovery respectively, with the year-on-year organic deficit narrowing from −39% in August to −25%, a 14-percentage-point improvement in a single month. Perplexity, the AI-powered answer engine, generated its first recorded referral sessions in September 2025, joining ChatGPT.com as a second AI platform sending real sessions to the website.
Booking clicks recovered to 43, a 72% month-on-month increase from August’s 25. 2 keywords temporarily fell to the second page of search results during September, caused by a combination of ongoing cannibalization pressure and the tail end of Google Spam Update activity. The dental implants treatment page received a full on-page optimisation round during September, including WebPage and Service schema deployment, meta title and description refinement, removal of unnatural keyword insertions from body copy, and new internal links from high-click blog posts.
Metric
September 2025
MoM Change
YoY Change
All Traffic
699
+25%
−25% vs Sep 2024 (938)
Organic Traffic
546
+24%
−25% vs Sep 2024 (730)
New Users
439
+18%
—
Online Booking Clicks
43
+72% MoM recovery
—
YoY organic gap
−25%
Narrowed from −39% in Aug
14 percentage points recovered
Perplexity referral traffic
First recorded appearance
—
—
September 2025: 699 all sessions, 546 organic. +24% organic MoM recovery. YoY gap narrows from −39% to −25%. Perplexity appears as a referral source.
How Did October 2025 Produce a 25-Position Aggregate Ranking Jump Alongside the Australian Launch of Google AI Mode?
October 2025 held traffic at 692 all sessions and 536 organic sessions while delivering a 25-position aggregate keyword ranking improvement in a single month, the largest single-month ranking gain of the campaign. This result was the product of compounding cannibalization fixes, schema implementations, and concentrated internal linking across the preceding months.
Google AI Mode launched in Australia on October 8, 2025. Google AI Mode is the dedicated full-screen AI search experience within Google that generates conversational answers to search queries. The practice’s schema infrastructure and content depth positioned the site for citation within AI-generated answers from launch day. AI platform visibility recorded 70 results across all platforms in October. The year-on-year gap continued closing, moving from −25% to −21% on all traffic and from −25% to −22% on organic.
Metric
October 2025
MoM Change
YoY Change
All Traffic
692
−1%
−21% vs Oct 2024 (875)
Organic Traffic
536
−2%
−22% vs Oct 2024 (691)
New Users
432
−2%
—
Online Booking Clicks
38
−12%
—
Aggregate keyword ranking improvement
+25 positions
Best single-month ranking jump
—
AI Visibility (all platforms)
70 results
—
—
Google AI Mode Australia launch
Oct 8, 2025
Schema foundation active at launch date
—
October 2025: 692 all sessions, 536 organic. Rankings improved +25 positions in aggregate — the campaign’s strongest single-month ranking jump. Google AI Mode launched in Australia October 8, 2025.
What Did the First Formal AI Visibility Measurement in November 2025 Record?
November 2025 produced 667 all sessions and 488 organic sessions, with the campaign’s first formal AI platform visibility measurement recording 64 results across all AI platforms. Traffic was down 4% and 9% month-on-month respectively. Search Console data confirmed the traffic reduction concentrated in high-intent local pages as seasonal demand shifted away from booking intent.
The November pattern reflects the seasonal shift that occurs annually as summer approaches and patients research elective cosmetic options in the early consideration phase without immediate booking intent. The cosmetic dentistry treatment page received a comprehensive optimisation round: refreshed meta title and description incorporating unique selling points and E-E-A-T signals, updated image alt text, and simultaneous deployment of Dentist schema, WebPage schema, and Service schema. A cannibalization check on Pyrmont keyword variations identified 3 pages surfacing in Search Console for the primary term. Anchor text on all 3 pages was updated to geo-modified versions linking back to the homepage.
Metric
November 2025
MoM Change
YoY Change
All Traffic
667
−4%
−18% vs Nov 2024 (811)
Organic Traffic
488
−9%
−20% vs Nov 2024 (608)
New Users
409
−5%
—
Online Booking Clicks
26
−32%
—
AI Visibility, all platforms
64 results
First formal measurement
—
November 2025: 667 all sessions, 488 organic. First formal AI visibility measurement: 64 results across all AI platforms.
How Did December 2025 Close the Year-on-Year Gap to Just −6%, Down From the August −39% Deficit?
December 2025 produced 653 all sessions and 490 organic sessions, with the year-on-year organic deficit narrowing to just −6% versus December 2024’s 522 organic sessions. This represents a 33-percentage-point recovery in the year-on-year metric between August and December 2025.
AI platform visibility rose from 64 results in November to 82 results in December. All tracked keywords remained on the first page. Dental implants had recovered to position 3. Both suburb terms remained at position 1. The 33-percentage-point year-on-year recovery across 4 months directly reflects the compounding return on the cannibalization resolution, schema deployment, and content architecture work executed consistently throughout the campaign.
Metric
December 2025
MoM Change
YoY Change
All Traffic
653
−2%
−2% vs Dec 2024 (668)
Organic Traffic
490
+0.4%
−6% vs Dec 2024 (522)
New Users
394
−4%
—
Online Booking Clicks
24
−8%
—
AI Visibility, all platforms
82 results
Up from 64 in November
—
YoY organic gap
−6%
33 percentage points recovered from Aug trough
—
December 2025: 653 all sessions, 490 organic. YoY gap narrows to just −6% from −39% in August — 33 percentage points recovered. AI visibility: 82 results.
How Did the Second Half of 2025 Perform Across the Six Months of Peak Algorithmic and Seasonal Pressure?
The July–December 2025 period produced 4,041 all sessions, 3,116 organic sessions, 2,436 new users, and 183 online booking clicks at a monthly average of 519 organic sessions, 12% below the H1 2025 monthly average of 593. The year-on-year organic deficit closed from −39% in August to −6% by December despite simultaneous pressure from Australian winter seasonality, a Google Core Update, Google AI Mode’s October 8 Australian launch, and Spam Update activity.
Period
All Traffic
Organic
New Users
Booking Clicks
Monthly Avg Organic
H1 2025 (Jan–Jun)
4,519
3,556
2,917
260
593
H2 2025 (Jul–Dec)
4,041
3,116
2,436
183
519
H1 vs H2 change
−11%
−12%
−17%
−30%
−12%
The H2 reduction was driven by seasonality and algorithmic volatility, not by structural ranking losses. The closing of the year-on-year gap from −39% to −6% across the same period confirms that the underlying ranking health of the site was improving throughout what appeared, on a month-to-month basis, to be the campaign’s most difficult stretch.
July to December 2025: 4,041 total sessions, 3,116 organic, 183 online booking clicks. Second half impacted by seasonality, Core Update, and Google AI Mode launch — YoY gap closed from −39% to −6% by December.
What Did the Full 2025 Calendar Year Produce Across All 12 Months?
2025 Annual Metric
Total
Monthly Average
All Traffic
8,582
715
Organic Traffic
6,603
550
New Users
5,353
446
Online Booking Clicks
442
37
Google share of all traffic
74.6%
—
Direct share of all traffic
20.6%
—
Full year 2025: 8,582 total sessions, 6,603 organic, 5,353 new users, 442 online booking clicks.
How Did January 2026 Restore Year-on-Year Parity While AI Visibility Reached Its Campaign Peak of 115 Results?
January 2026 produced 819 all sessions and 656 organic sessions, with the all-traffic year-on-year deficit reducing to −1% versus January 2025’s 831 sessions and the organic year-on-year deficit reducing to −1% versus January 2025’s 661 sessions. AI platform visibility reached the campaign peak of 115 results and Google Gemini generated its first recorded referral sessions. Google Gemini, Google’s AI assistant platform, joined ChatGPT.com and Perplexity as a third simultaneous AI referral traffic source in January 2026. The practice was generating real patient sessions from 3 separate AI platforms without paid activity in any of those channels.
Metric
January 2026
MoM Change
YoY Change
All Traffic
819
+25%
−1% vs Jan 2025 (831)
Organic Traffic
656
+34% MoM
−1% vs Jan 2025 (661)
AI Visibility, all platforms
115 results
Campaign peak
—
Google Gemini referral
First recorded appearance
—
—
ChatGPT.com referral
Ongoing
Active since May 2025
—
How Did February 2026 Deliver the Campaign’s First Positive Year-on-Year Result at +27% Organic Growth?
February 2026 produced 804 all sessions and 641 organic sessions, the campaign’s first decisively positive year-on-year result. Organic traffic was 27% above February 2025’s 504 sessions and all traffic was 20% above February 2025’s 672 sessions. The Google February 2026 Discover Core Update, rolling from February 5 through February 27, added discovery-traffic volatility without reversing the structural improvement in organic search position.
The Google February 2026 Discover Core Update is a ranking system update targeting content appearing in Google Discover, Google’s personalised content feed that surfaces articles and pages to users based on their search history and interests. The update added minor month-on-month volatility but did not affect the site’s structural keyword rankings or the year-on-year growth trajectory. AI platform visibility held at 82 results. Google Gemini remained active as a referral source for the second consecutive month.
Metric
February 2026
MoM Change
YoY Change vs Feb 2025
All Traffic
804
−2%
+20% (672 to 804)
Organic Traffic
641
−2%
+27% (504 to 641) — campaign best
AI Visibility, all platforms
82 results
—
—
Google Gemini referral
Active
Second month
—
Google Feb 2026 Discover Update
Feb 5–27
Minor volatility, no lasting impact
—
The year-on-year recovery from −39% to +27% moved through 4 documented milestones: a +25-position aggregate ranking jump in October 2025; the YoY deficit closing from −39% to −6% by December 2025; YoY parity in January 2026; and the campaign’s first decisively positive year-on-year result of +27% in February 2026.
January–February 2026: 1,623 total sessions, 1,298 organic, 1,102 new users, 59 booking clicks. February YoY organic: +27%. AI visibility peaks at 115 results in January. Google Gemini joins ChatGPT.com as an active referral source.
What Were the Full Quantified Results Across the Entire 14-Month Campaign Period?
What Do the Campaign Totals Show Across January 2025 to February 2026?
The 14-month campaign period from January 2025 to February 2026 produced 10,295 total sessions, 7,992 organic sessions, 6,455 new users, and 499 online booking clicks.
Total sessions: 10,295
Total organic sessions: 7,992
New users who had never visited the website before: 6,455
Online booking clicks recorded: 499
499 online booking clicks across 14 months at an average of more than 35 per month represents 499 recorded decision-stage patient interactions. The highest single booking month was January 2025 at 50 clicks. The lowest single booking month was August 2025 at 25 clicks. That was the campaign’s toughest month by every other metric, yet it still generated 25 booking-intent actions from a site operating at seasonal and algorithmic minimum.
The 14-month cosmetic dental SEO campaign produced 499 online booking clicks at an average of 35 per month, a +87% impression surge from 395,000 to 738,000 placing the practice in front of 343,000 additional patient queries, and a 10.3-position average ranking improvement across the entire keyword portfolio.
How Did the Year-on-Year Trajectory Move From −39% to +27%?
Month
Prior Year Organic
Current Year Organic
YoY Change
April 2025
608
575
−5%
May 2025
665
572
−14%
June 2025
656
565
−14%
July 2025
785
521
−34%
August 2025
729
442
−39%, widest deficit
September 2025
730
546
−25%
October 2025
691
536
−22%
November 2025
608
488
−20%
December 2025
522
490
−6%
January 2026
661
656
−1%, near parity
February 2026
504
641
+27%, positive swing
The table above shows a 66-percentage-point swing in the year-on-year metric across 6 months. Each month’s movement reflects the compounding output of structural work completed in prior months rather than responses to individual month-by-month ranking signals.
How Did Keyword Rankings Perform Across All Tracked Terms Over 18 Months?
Keyword Type
Sep 2024
Best Position Achieved
Feb 2026
First-Page Status
Suburb dentist term 1
1
1
1
Position 1, 18 consecutive months
Suburb dentist term 2
1
1
1
Position 1, 18 consecutive months
Primary Pyrmont keyword
5
3
Top 7
First page throughout
Dental implants suburb variant
5
3
3
First page throughout
Dental clinic suburb variant
—
2
7
First page throughout
Teeth whitening suburb variant
6
4
7
First page throughout
Orthodontics suburb variant
—
7
9
First page throughout
Every tracked keyword finished the campaign on the first page of Google results. The 2 suburb dentist terms held position 1 for all 18 consecutive months without a single drop to position 2.
How Did AI Platform Visibility Grow From Zero Tracked Results to 115?
Month
AI Platform Results
New AI Referral Sources
May 2025
—
ChatGPT.com (OpenAI), first referral sessions recorded
Sep 2025
—
Perplexity, first referral sessions recorded
Oct 2025
70
—
Nov 2025
64
—
Dec 2025
82
—
Jan 2026
115, campaign peak
Google Gemini, first referral sessions recorded
Feb 2026
82
All 3 platforms active simultaneously
AI platform visibility grew from zero tracked results at campaign start to 115 results across ChatGPT.com (active since May 2025), Perplexity (active since September 2025), and Google Gemini (active since January 2026). Schema infrastructure deployed from month one produced unpaid patient referral sessions from 3 AI platforms simultaneously.
What Did the Google Search Console Three-Month Comparison Confirm?
Google Search Console data comparing the 3 months ending February 2026 against the preceding 3 months (September through November 2025) recorded 2,240 clicks versus 1,690 clicks (+33%), 738,000 impressions versus 395,000 impressions (+87%), and average position improvement from 31.9 to 21.6, a 10.3-position improvement across the entire site’s keyword portfolio.
The 25-position aggregate ranking gain in October 2025 and the +27% year-on-year growth in February 2026 were not reactions to monthly algorithm signals. They were the scheduled outputs of cannibalization resolution, schema implementation, and technical work executed in the 8 preceding months. Structural discipline executed before the results appear is precisely the work that produces the results.
Total impressions nearly doubled, rising 87% from 395,000 to 738,000. An 87% impression increase means the site appeared in front of 343,000 more potential patient search queries across the 3-month period. The 10.3-position average position improvement reflects the cumulative outcome of cannibalization resolution, schema deployment, content architecture, and internal linking work across the preceding months, expressed as a measurable shift in the site’s average ranking across every query for which the site appeared.
The CTR movement from 0.4% to 0.3% reflects a mathematical outcome of impressions growing 87% while clicks grew 33%. When impressions grow at 2.6x the rate of clicks, the average CTR percentage declines. Total click volume increased by 550 clicks in absolute terms. The absolute click increase is the directly relevant commercial outcome.
GSC Metric
Previous 3 Months (Sep–Nov 2025)
Last 3 Months (Dec 2025–Feb 2026)
Change
Total Clicks
1,690
2,240
+33% (+550 clicks)
Total Impressions
395,000
738,000
+87%, nearly doubled
Average CTR
0.4%
0.3%
−0.1pp, impressions grew faster than clicks
Average Position
31.9
21.6
Improved by 10.3 positions
Google Search Console: Last 3 months vs previous 3 months. Clicks +33% (1,690 to 2,240). Impressions +87% (395K to 738K). Average position improved from 31.9 to 21.6.
What Technical Health Improvements Did the Campaign Deliver?
Technical health improvements across 9 work categories produced an Ahrefs site health score of 100 alongside a SiteChecker Pro score of 100, reached in July 2025 and maintained throughout the remainder of the campaign. These scores represent the resolution of dozens of individual technical issues across page-element, platform, schema, and link profile categories.
Looker Studio: Full campaign period January 2025 to February 2026 — 10,295 total sessions, 7,992 organic, 6,455 new users, 499 online booking clicks.
What Does This Cosmetic Dental SEO Campaign Demonstrate About Structurally Disciplined Organic Growth?
Structurally disciplined cosmetic dental SEO produces compounding returns that reactive, month-by-month adjustments cannot replicate. This PremiumSEOFirm’s campaign ran through 5 documented algorithm events: the Google March 2025 Core Update, a second Core Update rolling through August and September 2025, Google Spam Updates in October 2025, the Australian launch of Google AI Mode on October 8, 2025, and the Google February 2026 Discover Core Update. The campaign delivered +27% year-on-year organic growth in February 2026 against a trajectory that had reached a −39% year-on-year deficit in August 2025, a 66-percentage-point swing produced by the same structural work that was already in place before the swing began.
Each algorithm event received documented analysis within 48 hours of confirmed rollout. Cannibalization patrols ran monthly throughout all 18 months. Technical fixes addressed each new signal identified in SiteChecker Pro and Ahrefs as the monitoring cadence produced them. The 25-position aggregate ranking gain recorded in October 2025, the campaign’s largest single-month ranking improvement, was the direct result of cannibalization resolution, schema implementation, and internal linking decisions made in the 8 preceding months. It was not a reactive response to October’s algorithm environment. It was the scheduled output of structural work done correctly across the months before.
The Google Search Console data confirms the structural outcome: clicks up 33%, impressions up 87%, and average position improved by 10.3 positions across the site’s entire keyword portfolio between the September–November 2025 period and the December 2025–February 2026 period.
The 2 suburb dentist keywords held position 1 for all 18 consecutive months of the campaign. That ranking stability is the compounded result of monthly cannibalization monitoring, consistent anchor text management, and sustained citation building, decisions made correctly each month regardless of whether the month’s ranking data created immediate pressure to make them.
The AI visibility growth, from zero tracked results at campaign start to 115 results across ChatGPT.com, Perplexity, and Google Gemini by January 2026, with real referral sessions from all 3 platforms, is the outcome of schema infrastructure built from the campaign’s first month. The practice reached AI search visibility not by responding to AI search after it arrived, but by building the entity signals those platforms require before the traffic channel existed as a meaningful data category. That is the principle this campaign demonstrates: the structural work done before the results appear is precisely the work that produces the results.