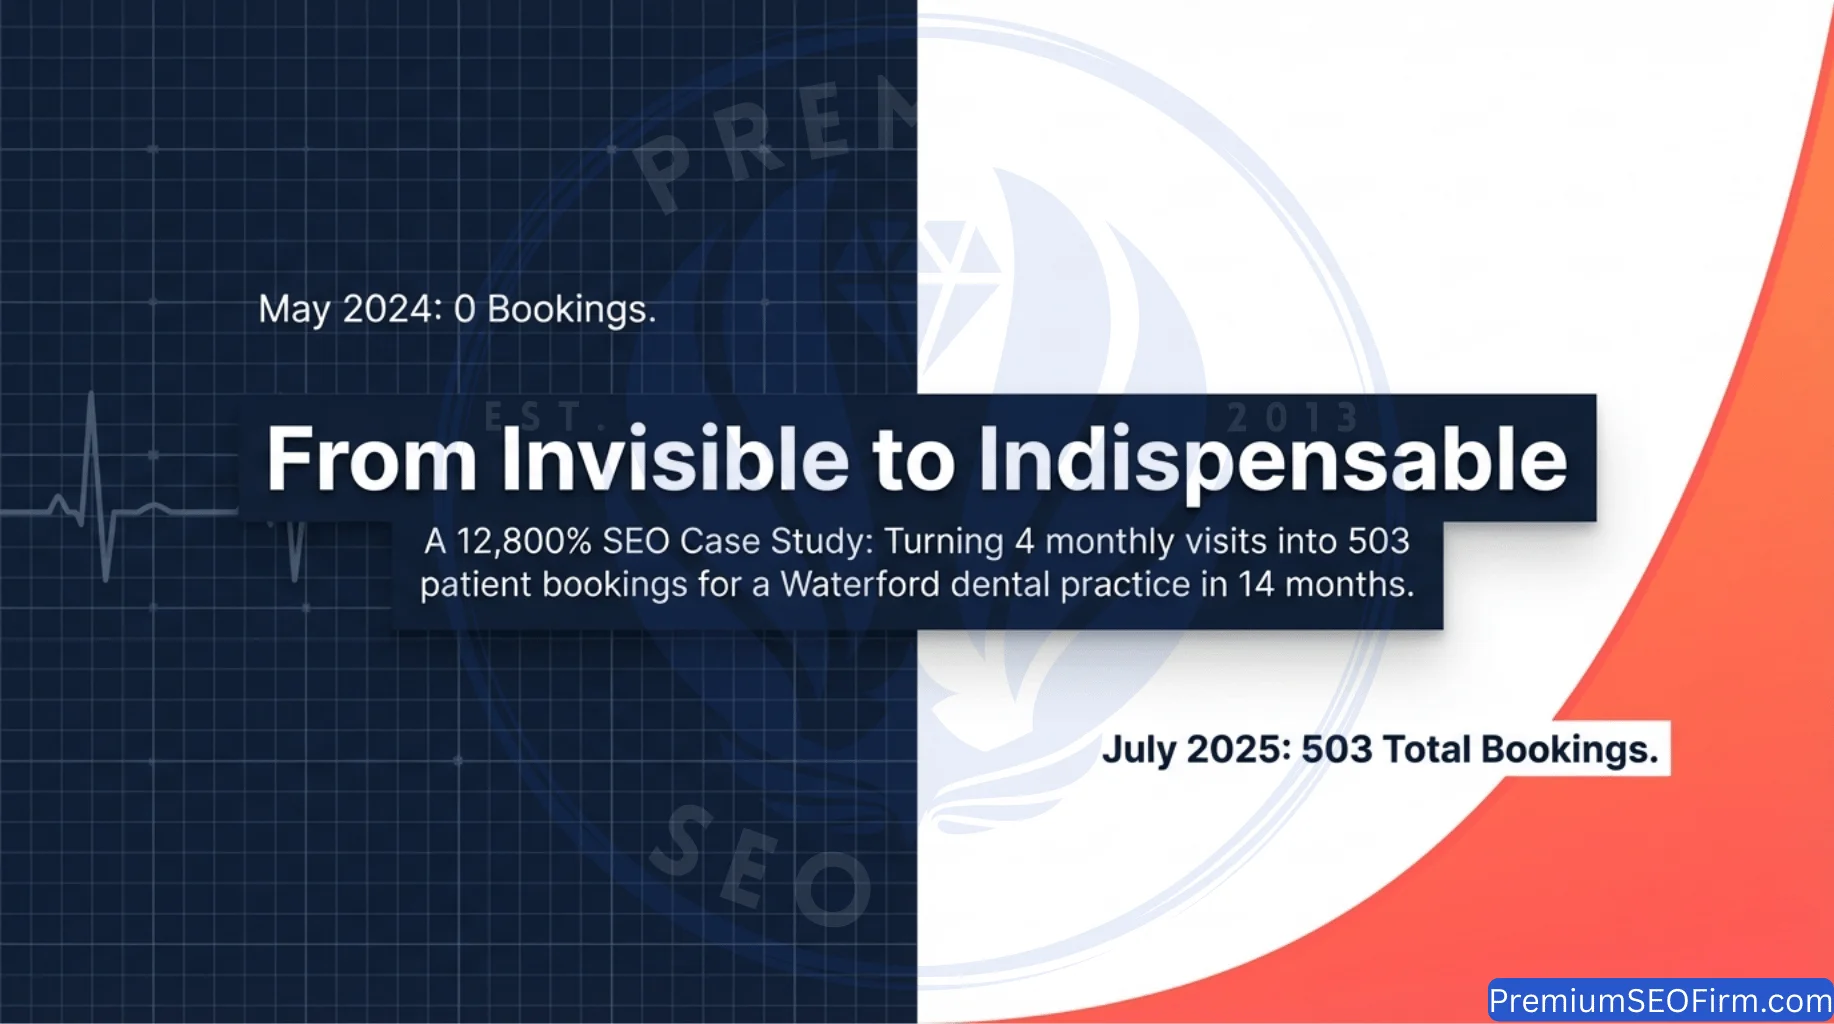
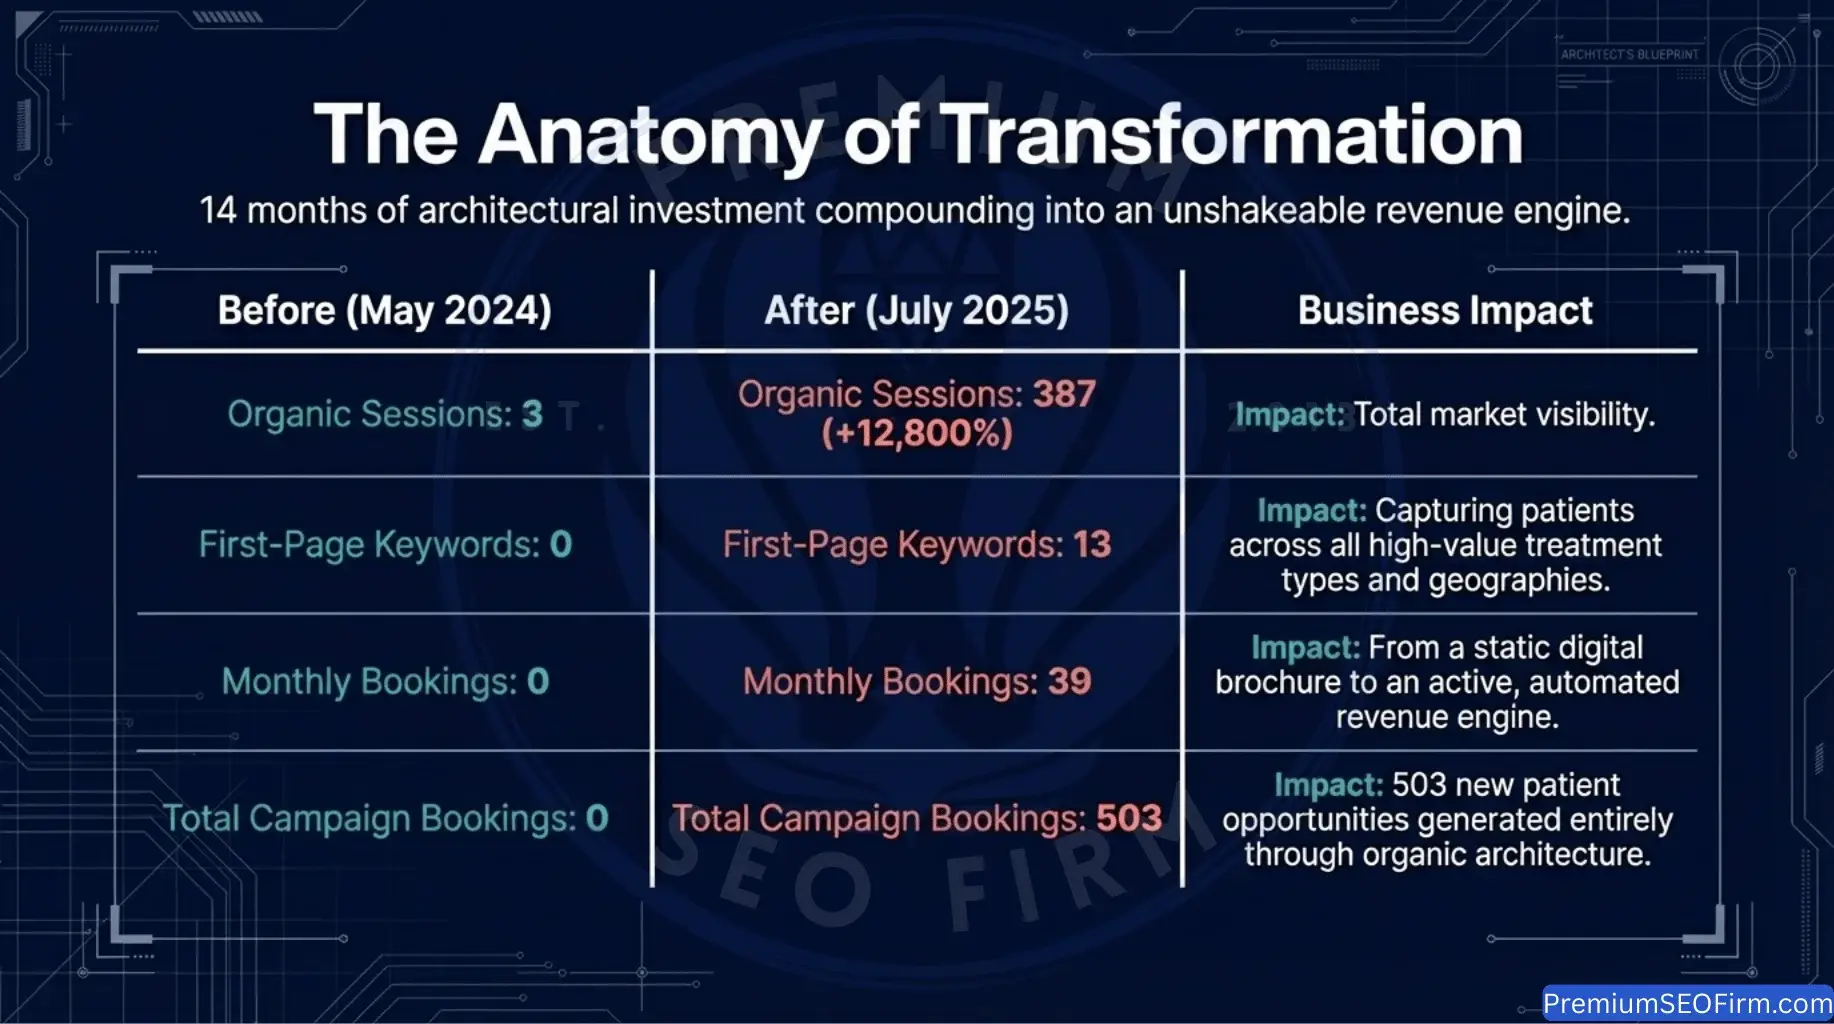
12800% Organic Traffic Growth for a Dental Practice in Waterford
A dental practice in Waterford, Queensland recorded 3 organic sessions and 0 online booking clicks in May 2024, the month before this dental SEO campaign began. By Month 14, the same practice recorded 387 organic sessions, 39 online booking clicks, 13 of 13 tracked keywords at page-one positions, and referral traffic from both ChatGPT (OpenAI) and Google Gemini (Google DeepMind) without paid activity in either AI channel.
The 14-month campaign ran from June 2024 to July 2025. Every tactic applied in each month, every result recorded, and every algorithm update is documented in sequence below. Months where growth was flat or booking metrics declined seasonally are included without omission.
This case study documents the full growth trajectory: from a site with 0 first-page rankings and 4 total monthly sessions, to a practice holding position 1 for its primary dentist keyword, 2 core treatment keywords, 3 suburb keywords, and page-one positions for all 13 tracked terms at campaign close.
What Practice and Market Does This Case Study Document?
What Services Does the Practice Offer?
The practice offers 6 primary treatment categories from a full-service dental clinic in Waterford, Queensland, serving patients from 7 surrounding suburbs: Bethania, Kingston, Edens Landing, Crestmead, Park Ridge, Marsden, and Waterford West. The 6 treatment categories are general dentistry, cosmetic treatments including teeth whitening and clear aligners, dental implants, orthodontics, children’s dentistry, and emergency dental care.
Why Did the Brisbane South Dental Market Present Ranking Challenges?
Brisbane south presented 2 dominant competitor categories that made ranking difficult for a new site: corporate dental chains running multi-location operations with dedicated SEO budgets, and long-established independent practices with years of accumulated online authority. Ranking in this market required a structured campaign across 6 parallel work streams. Isolated optimisations applied one at a time do not produce consistent first-page results in a market with these 2 competitor types.
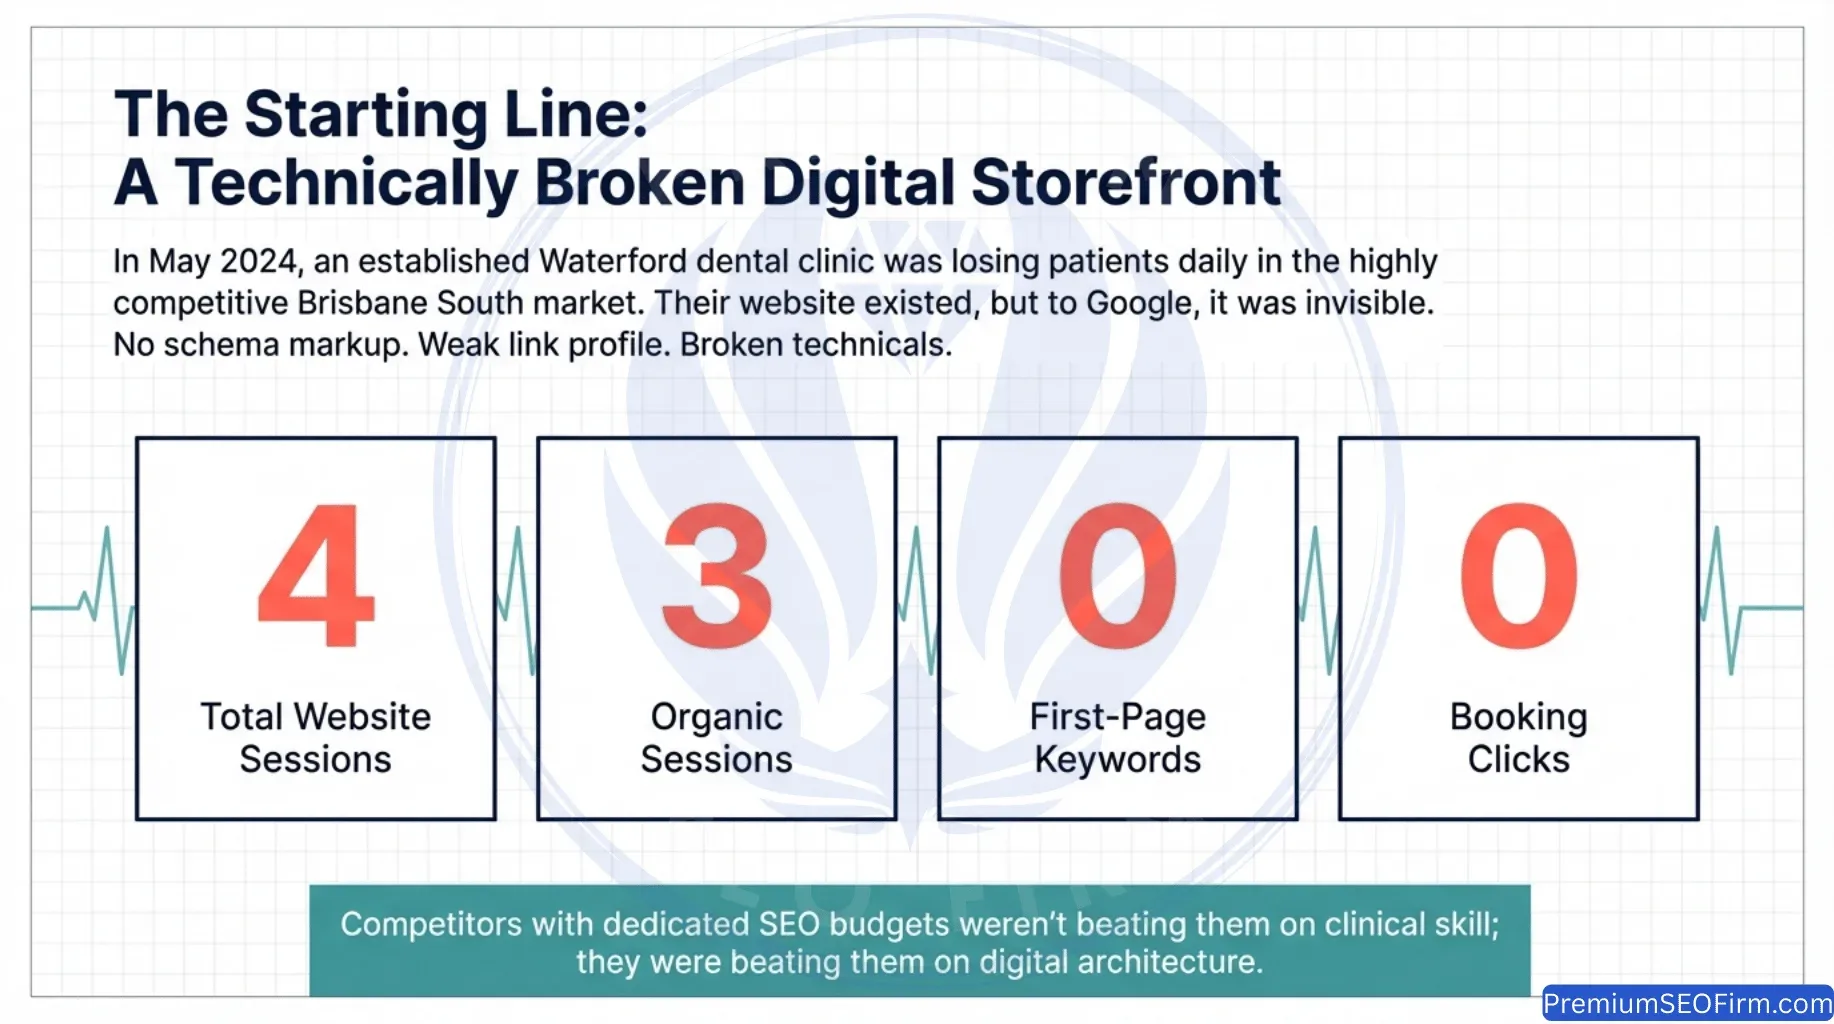
Why Did the Site Have Zero Organic Visibility Before the Campaign?
4 specific deficiencies produced the zero-visibility baseline on a site that had been live before the practice engaged this agency: no schema markup on any page, no properly structured content, a weak and inconsistent link profile, and technical crawl barriers blocking Google from reading and indexing pages correctly.
Schema markup is structured code embedded in a webpage that communicates directly to Google and AI platforms what a page covers in machine-readable format. Schema markup was absent from every page on this site. Without schema markup, Google cannot reliably determine a page’s business type, service category, or geographic service area. These 4 deficiencies combined kept the site invisible despite active patient demand for the practice’s services in the local market.
What Were the Baseline Metrics Before the Campaign Began?
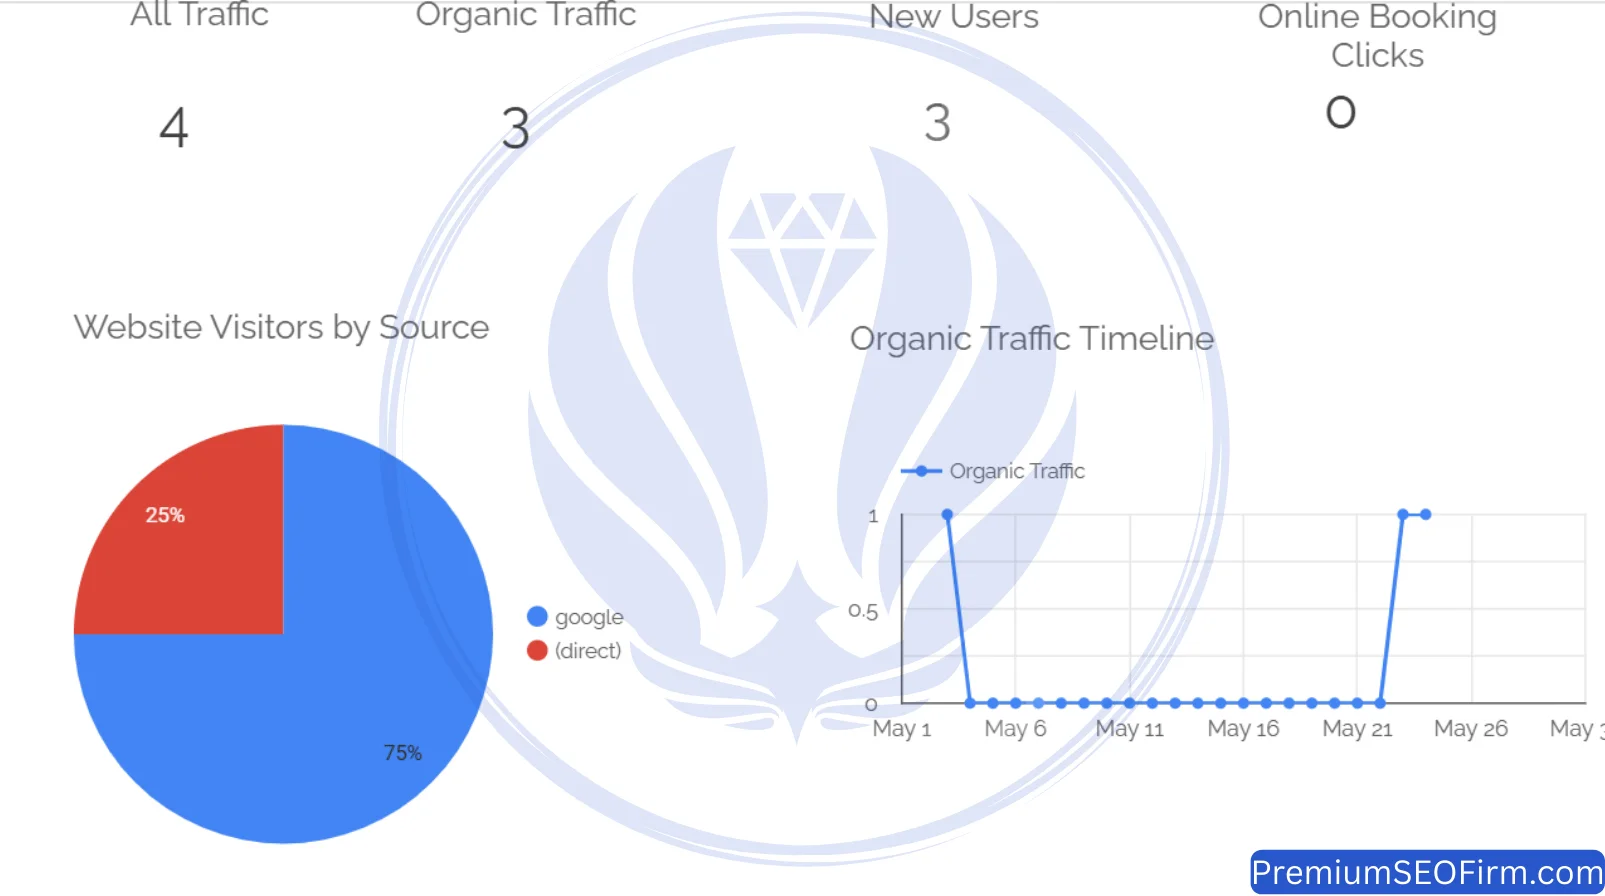
The site produced no commercial activity from search in the pre-campaign baseline month. The table below records the complete baseline metrics for May 2024 across 6 measurement dimensions: total sessions, organic sessions, new users, online booking clicks, Google traffic share, and first-page keyword count.
| Metric | May 2024 (Pre-Campaign) |
|---|---|
| Total Website Sessions | 4 |
| Organic Sessions (Google) | 3 |
| New Users | 3 |
| Online Booking Clicks | 0 |
| Google Traffic Share | 75% |
| First-Page Keywords | 0 |
A 75% Google traffic share on a site receiving only 4 total monthly sessions means the site appeared for almost no search queries. The 0 booking clicks record that the website contributed nothing to patient acquisition in May 2024.
What 6-Stream Strategy Governed All 14 Campaign Months?
How Did the Pre-Campaign Audit Shape the Campaign Structure?
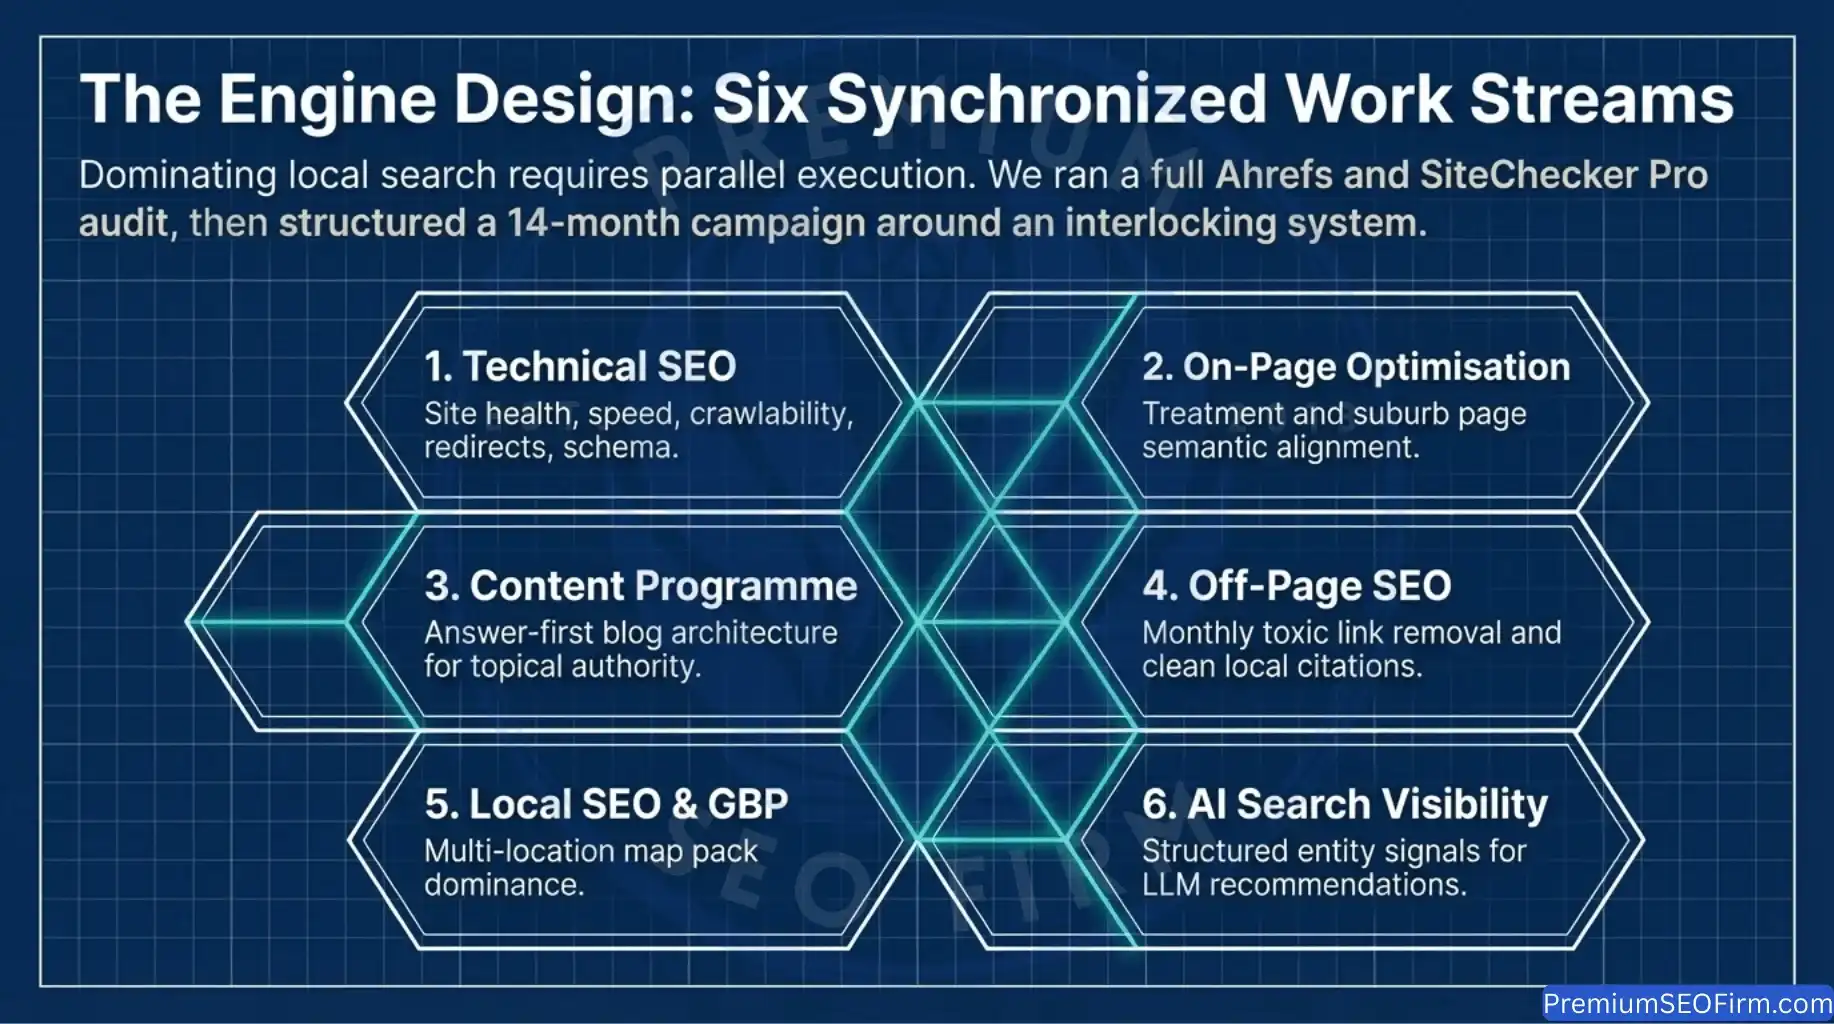
The pre-campaign audit produced a 6-stream campaign structure that ran in parallel across all 14 months. The audit used SEO analytics platform Ahrefs (Ahrefs Pte. Ltd.) and technical crawl tool SiteChecker Pro. Ahrefs identified the deficiencies producing zero visibility. SiteChecker Pro confirmed the order of technical fixes needed for the fastest path to ranking improvement.
The table below outlines each of the 6 work streams, what each stream covers, and why each stream matters for a local dental practice competing against established corporate operators.
| Work Stream | What It Covers | Why It Matters |
|---|---|---|
| Technical SEO | Site health, speed, crawlability, redirects, schema | Broken technical foundations make all other SEO work underperform |
| On-Page Optimisation | Treatment pages, suburb pages, homepage, internal links | Each page needs to clearly signal its target keyword to rank competitively |
| Content Programme | Monthly blog articles targeting patient research queries | Builds topical authority that lifts rankings across all commercial pages |
| Off-Page SEO | Citation building plus monthly toxic link removal | A clean, authoritative link profile is needed for sustainable local rankings |
| Local SEO and GBP | Google Business Profile management and local signals | Local map pack rankings appear above organic results for location-based queries |
| AI Search Visibility | Schema depth, entity signals, content structure for AI platforms | ChatGPT, Gemini, Grok, and Claude use the same structured data signals Google uses |
No single work stream produces lasting results in isolation. Technical SEO without content produces a fast, structurally empty site. Content without technical SEO produces articles Google cannot properly crawl. Off-page link building without on-page foundations builds authority on an unstable base. Each stream reinforces the others. Running all 6 in parallel produced the compounding growth trajectory documented in the month-by-month data below.
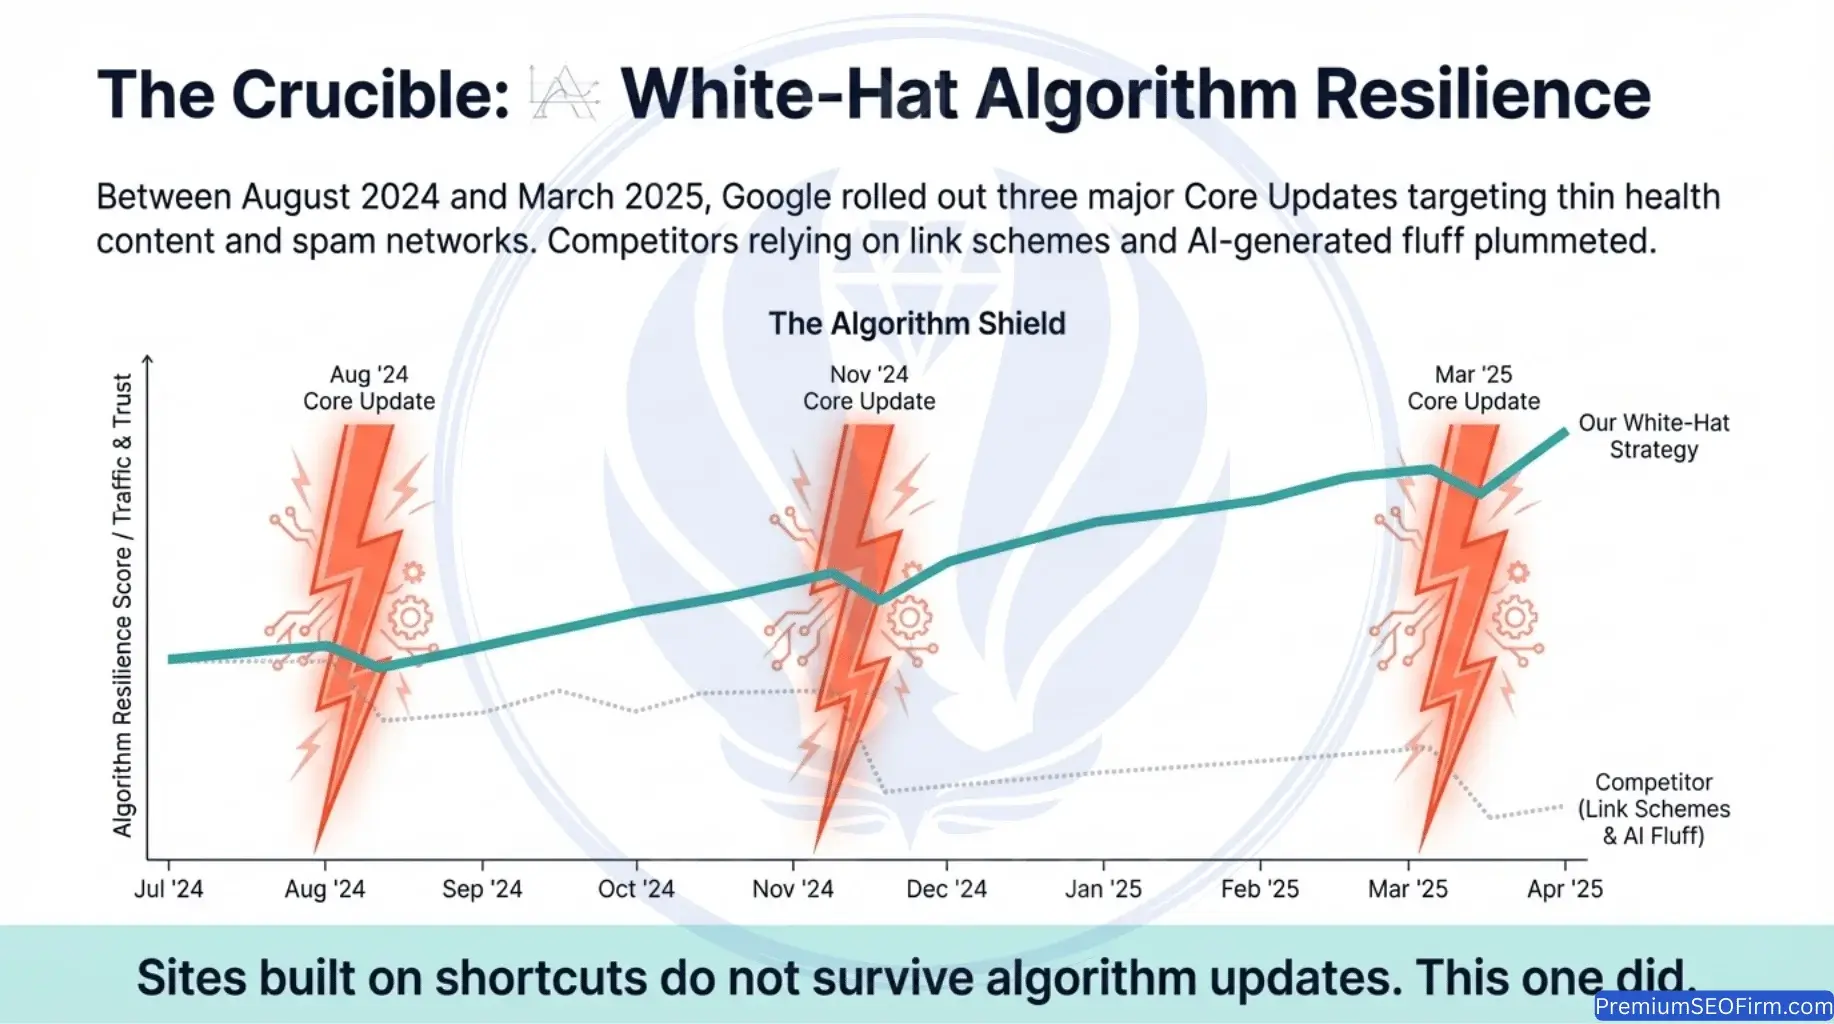
How Did White Hat SEO Practices Protect Rankings Through 3 Algorithm Updates?
White hat SEO practices protected all first-page rankings through 3 major Google Core Updates during this campaign: the August 2024, November 2024, and March 2025 Core Updates. White hat SEO is the practice of building visibility through content quality, structural clarity, and genuine information. White hat SEO does not use private blog networks, link schemes, keyword stuffing, or cloaking. The site carried no technical or content vulnerabilities for those 3 updates to identify and penalise, so no first-page ranking was lost across any of the 3 rollout periods.
Month 1, June 2024: The Technical Foundation Sprint
What Were the Month 1 Traffic Results?
June 2024 produced 154 total sessions and 138 organic sessions from a May 2024 baseline of 4 total sessions and 3 organic sessions. The table below compares June 2024 performance against the May 2024 baseline across 5 metrics.
| Metric | June 2024 | vs May 2024 Baseline |
|---|---|---|
| Total Sessions | 154 | +3,750% |
| Organic Sessions | 138 | +4,500% |
| New Users | 112 | +3,633% |
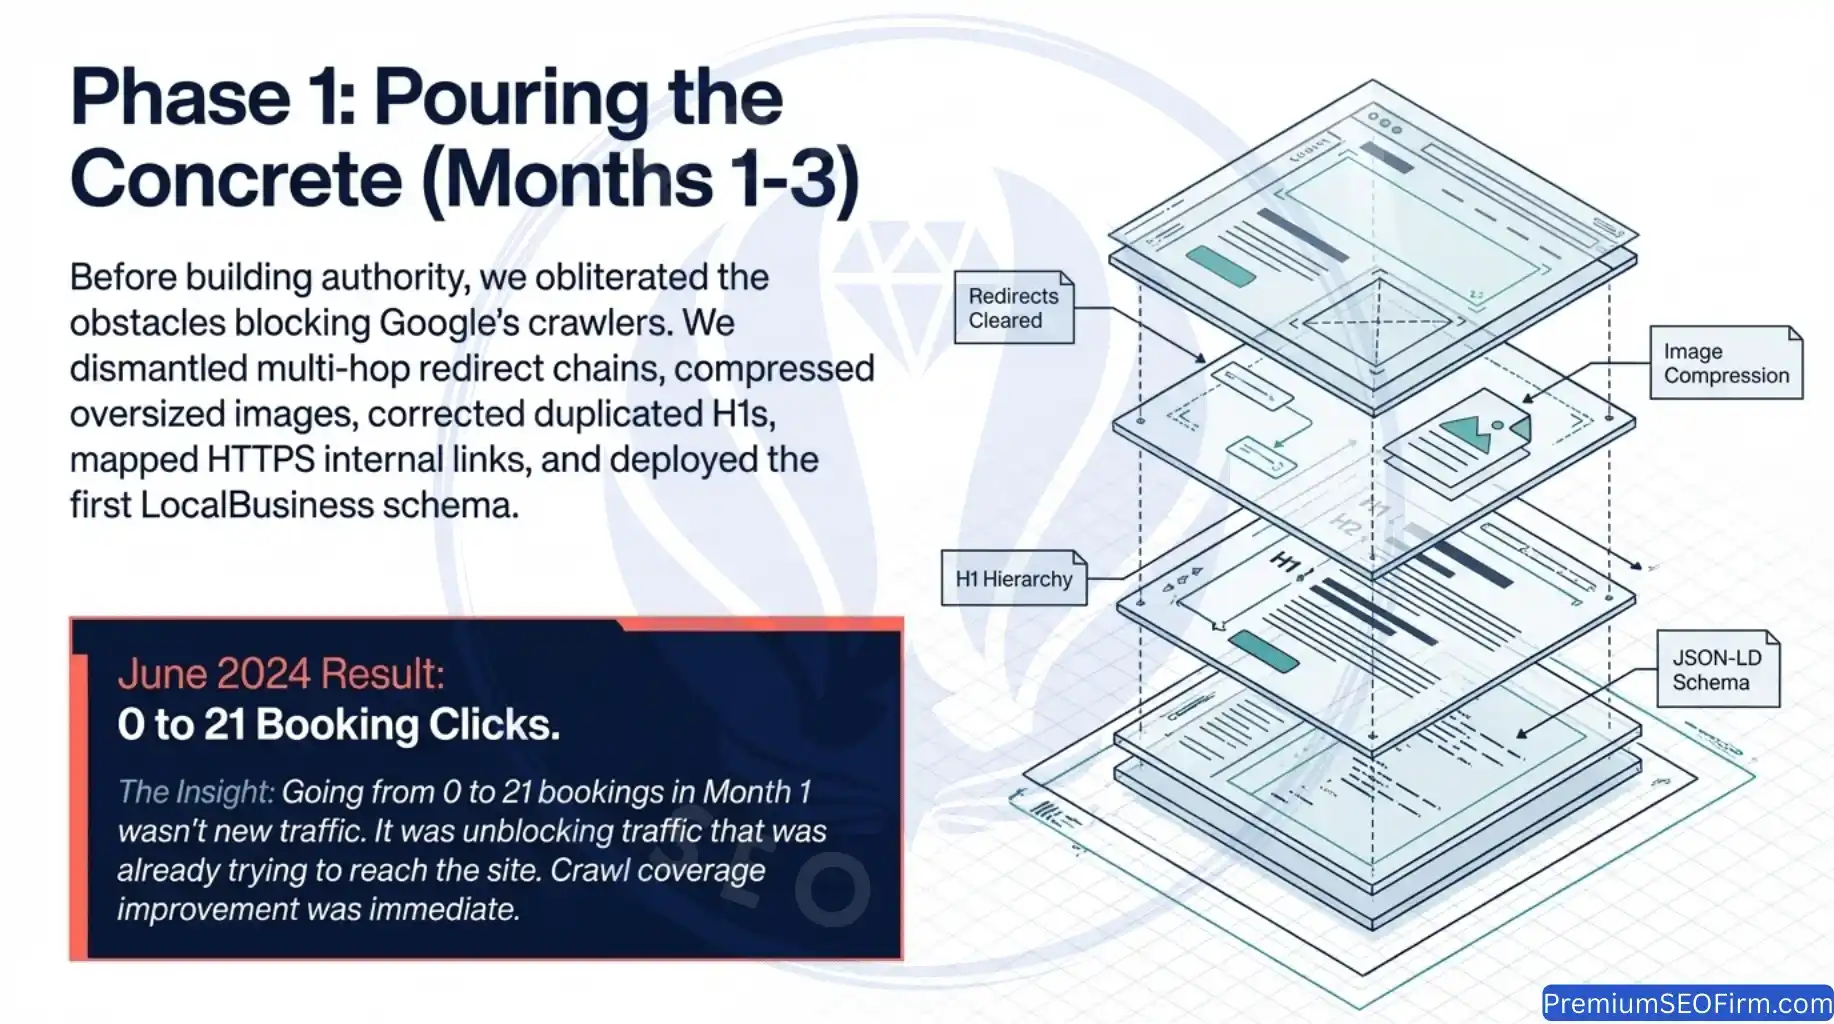
| Booking Clicks | 21 | From zero |
| Google Traffic Share | 85.7% | Strong organic start |
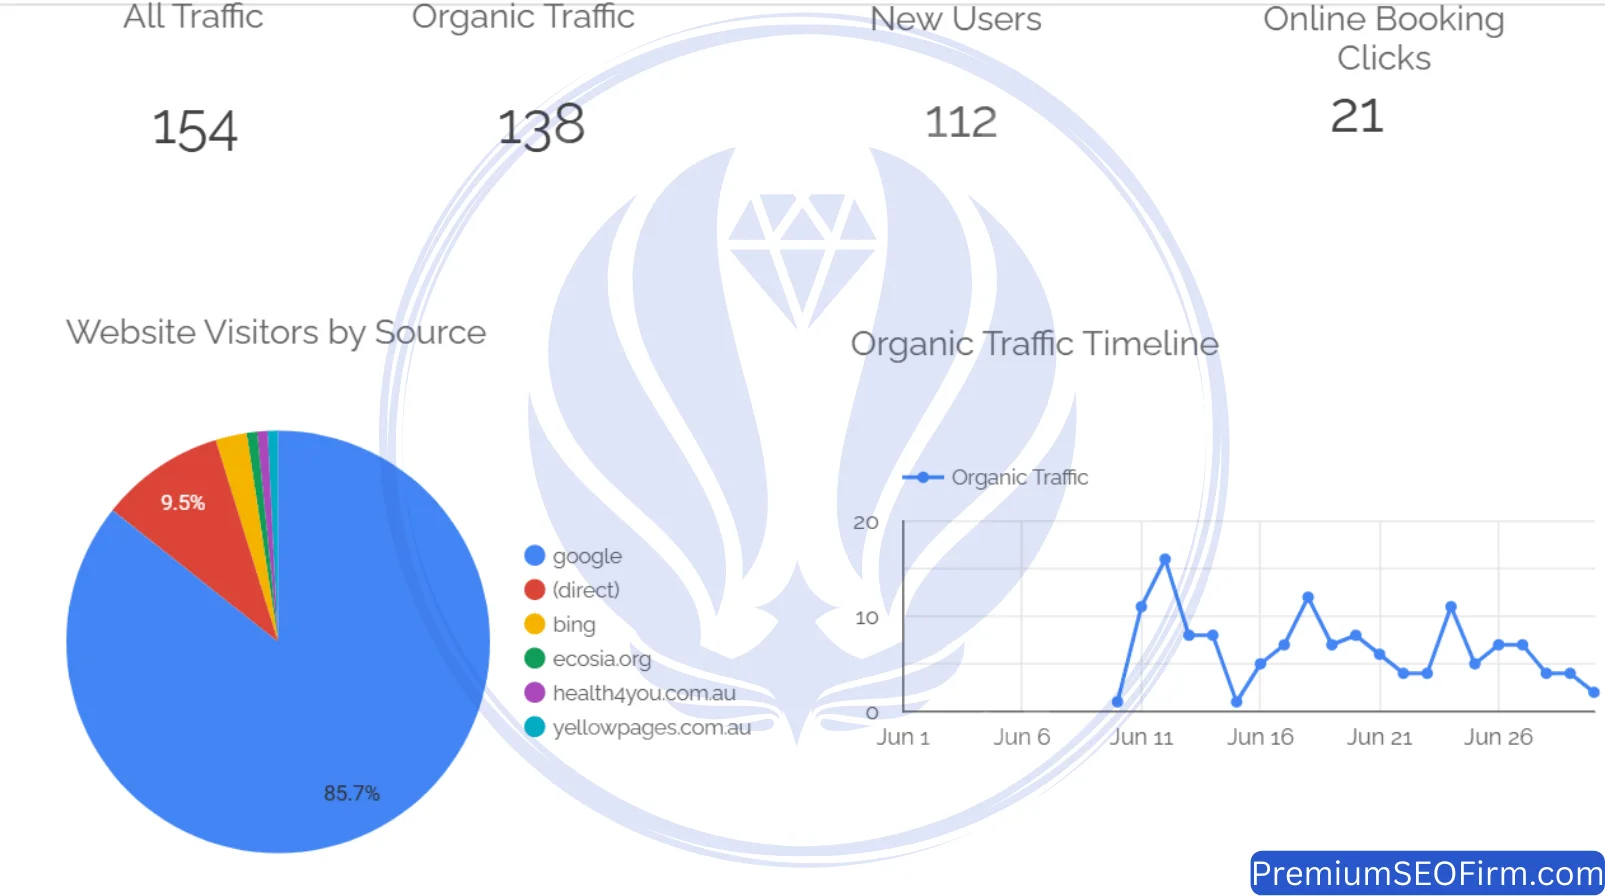
The jump from 4 sessions to 154, and from 0 booking clicks to 21, confirms the pre-campaign audit findings. The site was not underperforming because of weak market demand. Technical barriers were blocking Google from crawling and indexing pages correctly. Removing those barriers in Month 1 released traffic that had already been building behind them.
What Technical Work Did Month 1 Focus On?
Month 1 ran 7 distinct technical fixes, each targeting a specific crawl or indexation deficiency identified in the pre-campaign audit. The campaign launched on June 1, 2024. All 7 fixes ran within that month, each addressing a different technical error confirmed by the Ahrefs and SiteChecker Pro audit outputs.
How Did Redirect Chain Cleanup Restore Authority Flow to Target Pages?
Redirect chain cleanup restored ranking authority to target pages by replacing multi-hop URL chains with direct connections. A redirect chain is what happens when a URL bounces through 2 or 3 intermediate addresses before reaching its final destination. Each intermediate hop reduces the ranking authority transferred to the final URL. Every multi-hop chain on the site was replaced with a direct connection, consolidating full authority onto each target page.
How Did Image Compression and Core Web Vitals Optimisation Affect Page Performance?
Image compression improved Core Web Vitals scores across the site’s key landing pages. Google’s Core Web Vitals framework measures page loading performance across 3 metrics: Largest Contentful Paint (LCP, measuring how quickly the main content loads), Cumulative Layout Shift (CLS, measuring visual stability during loading), and Interaction to Next Paint (INP, measuring how quickly the page responds to a user’s first click or tap). All oversized images were compressed and converted to next-generation formats where browser support confirmed reliable delivery. Lazy loading was applied to all images appearing below the visible screen area, deferring load requests until the user scrolled toward them.
How Did Heading Structure Corrections Improve Google’s Topic Recognition?
Heading structure corrections resolved duplicate H1 problems that were blocking Google from identifying each page’s primary topic. The H1 tag is the primary heading on a page. The H1 tag signals the page’s primary topic. The H1 tag appears exactly once per page. Multiple pages on this site carried more than 1 H1 heading, a structural error that forces Google to split its topic assessment across competing declarations. H2 and H3 subheadings were rebuilt from random placement into a logical topical hierarchy, so Google’s crawlers could read each page’s content structure accurately.
How Were Meta Descriptions Rewritten to Improve Click-Through Rate?
Meta descriptions were rewritten to include the primary keyword within the first 70 characters and to carry a specific patient-benefit signal. A meta description is the short text snippet appearing under a page’s title in Google search results. A meta description does not directly affect rankings, but a meta description directly controls how many patients click through from search results to the site. Each rewritten meta description included appointment availability, a specific treatment category, or a measurable outcome, replacing the generic placeholder text that had previously occupied those positions.
What Schema Markup Was Deployed in Month 1?
LocalBusiness schema markup was deployed on the homepage in Month 1, communicating the practice’s location, services, business hours, contact details, and service area to Google in structured, machine-readable format. This was also the first structured entity signal contributing to AI platform visibility, the visibility that appeared as referral traffic in Month 10. AI platforms including ChatGPT (OpenAI), Google Gemini (Google DeepMind), Grok (xAI), and Claude (Anthropic) read the same structured data signals that Google reads. Building those signals from Month 1 built Google ranking signals and AI referral signals simultaneously, from the same technical work.
Why Did Platform and Security Updates Run in Month 1?
Platform updates ran in Month 1 to eliminate security vulnerabilities and rendering compatibility gaps in the same maintenance window. WordPress, all installed plugins, and the PHP server version were updated to current stable releases on launch day. Outdated platform versions create security vulnerabilities that Google’s Safe Browsing system detects and treats as quality signals. Outdated PHP and plugin versions also reduce compatibility with how Google renders and indexes JavaScript-heavy pages.
How Did HTTP to HTTPS Internal Link Correction Consolidate Ranking Authority?
HTTP to HTTPS internal link correction consolidated ranking authority onto the correct canonical versions of all pages. Internal links throughout the site were pointing to HTTP versions of pages even though the site was running on HTTPS. This HTTP/HTTPS mismatch creates a duplicate URL signal, causing Google to split ranking authority between the HTTP and HTTPS versions of the same page. Every internal link was corrected to HTTPS, removing the authority split and consolidating equity onto the canonical HTTPS URL for each page.
Why Did Month 1 Produce Immediate Organic Traffic Results?
Month 1 produced a 4,500% organic traffic increase because technical remediation released blocked traffic, not because new content created new demand. Google was not sending traffic to the site because technical errors prevented Google from crawling and indexing pages correctly. The Month 1 technical fixes removed those crawl barriers. Traffic released by technical remediation responds immediately because indexed pages begin appearing in search results as soon as Googlebot re-crawls them after the barriers are removed. Content-driven traffic growth takes weeks to months to build. Technical remediation traffic growth is immediate.
Month 2, July 2024: On-Page Optimisation Begins and Bookings Double
What Were the Month 2 Traffic Results?
July 2024 recorded 261 total sessions, 214 organic sessions, and 45 booking clicks, with booking clicks growing 114.3% against June 2024’s 21. The table below shows July 2024 performance against June 2024 across 5 metrics.
| Metric | July 2024 | Month-on-Month Change |
|---|---|---|
| Total Sessions | 261 | +69.5% |
| Organic Sessions | 214 | +55.1% |
| New Users | 177 | +58% |
| Booking Clicks | 45 | +114.3% |
| Google Traffic Share | 78.1% | Multi-source traffic emerging |
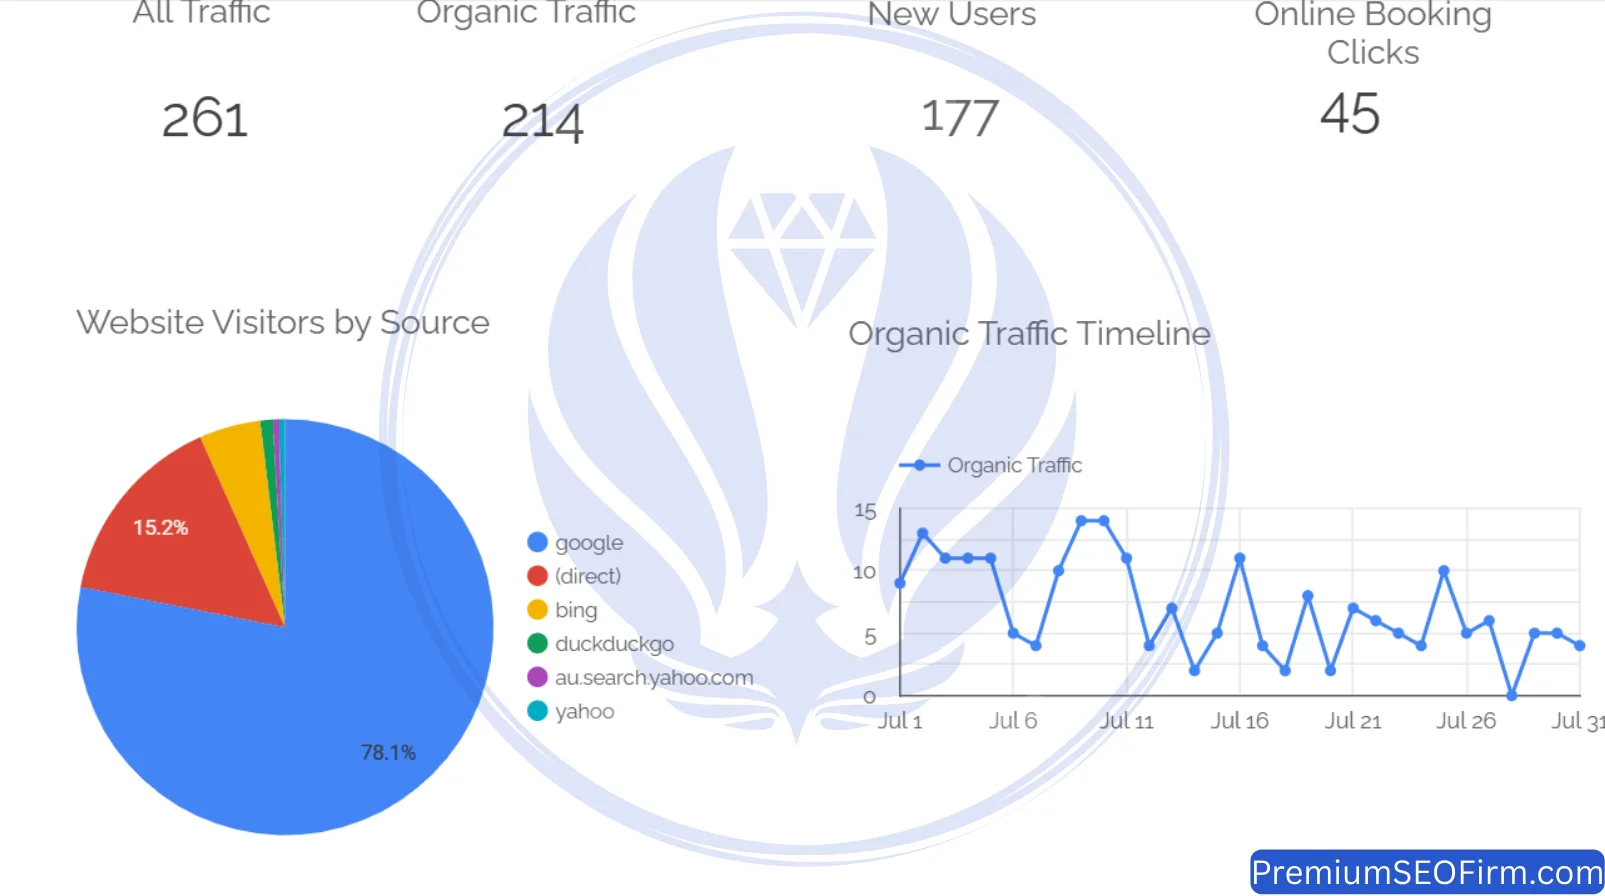
Booking clicks grew 44.8 percentage points faster than total sessions. On-page changes in Month 2 attracted visitors with higher appointment intent, not merely more visitors in aggregate.
How Did the Treatment Page Optimisation Cycle Begin in Month 2?
The treatment page optimisation cycle began in Month 2 with the dental implants page and the teeth whitening page as the first 2 targets. Both pages received complete meta title rewrites, heading structure rebuilds, and semantic term additions sourced from a content gap analysis using content optimisation platform Surfer SEO. Surfer SEO compares the target page against the top-ranking competitor pages for the same keyword and identifies which terms, phrases, and structural elements are present in those ranking pages but absent from the target page. Closing those gaps moves pages from mid-ranking positions toward page one.
What Meta Title Strategy Applied to Treatment Pages?
Meta titles followed a 3-element pattern: treatment name within the first 30 characters, location signal, and a short differentiating modifier. A meta title tells both Google and the searching patient what a page covers. Placing the primary keyword within the first 30 characters gives the keyword maximum relevance weight. Google’s title display algorithm weights characters toward the front of the title more heavily and truncates titles that exceed the character limit from the end.
Why Did Viewport Meta Tag Corrections Matter for Mobile Rankings?
Viewport meta tag corrections resolved a usability error that Google’s mobile-first indexing system reads as a negative ranking signal. Several pages had incorrect viewport meta tag settings that prevented mobile users from scaling the page correctly. Mobile-first indexing means Google uses the mobile version of a page as the primary signal for ranking decisions. Any mobile usability problem directly affects the page’s ranking eligibility. Every viewport tag across the site was corrected to the standard responsive viewport specification within the Month 2 reporting period.
How Was Schema Markup Extended to Treatment Pages in Month 2?
Service schema in JSON-LD format was added to the main treatment pages in Month 2. JSON-LD (JavaScript Object Notation for Linked Data) is Google’s recommended structured data format. JSON-LD sits in the page code separately from visible content and explicitly declares the dental service name, the provider entity, the geographic location, and the service area. These structured declarations give AI platforms including ChatGPT (OpenAI), Google Gemini (Google DeepMind), Grok (xAI), and Claude (Anthropic) clear, machine-readable information to draw from when recommending dental services to patients querying those platforms.
How Did the First Internal Link Architecture Pass Build Authority Flow?
The first internal link architecture pass added new authority-flow connections from the homepage to both optimised treatment pages. Internal links are the mechanism through which ranking authority moves around a website. A homepage receiving strong backlinks transfers that authority to treatment and suburb pages through well-structured internal links. New internal links from the homepage to both Month 2 treatment pages used location-specific anchor text matching each treatment page’s primary keyword.
What Was the Initial Citation Building Strategy?
The first citation batch submitted in July 2024 used an exact NAP format maintained identically across every future submission. Citations are the NAP (Name, Address, Phone) entries for a local business across external directories. Google uses citation consistency to verify that a local business exists at the address the site declares. The first batch covered Australian online directories, health platforms, and business listing sites. Zero discrepancies in NAP format across all 14 months of submissions supported consistent geographic verification signals.
Why Did the First Disavow File Submission Run in Month 2?
The first disavow file submission ran in Month 2 to remove the initial batch of toxic backlinks identified in the Ahrefs audit. Toxic backlinks are links from spam directories, automated link networks, and low-quality sites that reduce a domain’s quality signals in Google’s link assessment framework. The Google Disavow Tool allows site owners to instruct Google to exclude specific links from link profile evaluation. The first disavow file was prepared and submitted to Google Search Console in Month 2, beginning the monthly toxic link removal programme that ran for the full 14 months.
What Drove the 114.3% Booking Click Increase in Month 2?
The 114.3% booking click increase outpaced the 69.5% total traffic increase by 44.8 percentage points, a gap that records on-page changes improving page quality, not just traffic volume. More visitors produced more clicks as a baseline effect. The additional 44.8 percentage-point gap above the traffic growth rate records improved page structure and clearer treatment information delivering higher appointment intent from each visitor who arrived.
Month 3, August 2024: Technical Completion and the Google August Core Update
What Were the Month 3 Traffic Results?
August 2024 recorded 261 total sessions, matching July 2024 exactly, through the full rollout period of the Google August 2024 Core Update. The table below shows August 2024 results against July 2024 across 5 metrics.
| Metric | August 2024 | Month-on-Month Change |
|---|---|---|
| Total Sessions | 261 | 0% (consolidation) |
| Organic Sessions | 207 | -3.3% |
| New Users | 179 | +1.1% |
| Booking Clicks | 36 | -20% |
| Google Traffic Share | 79.8% | Stable |
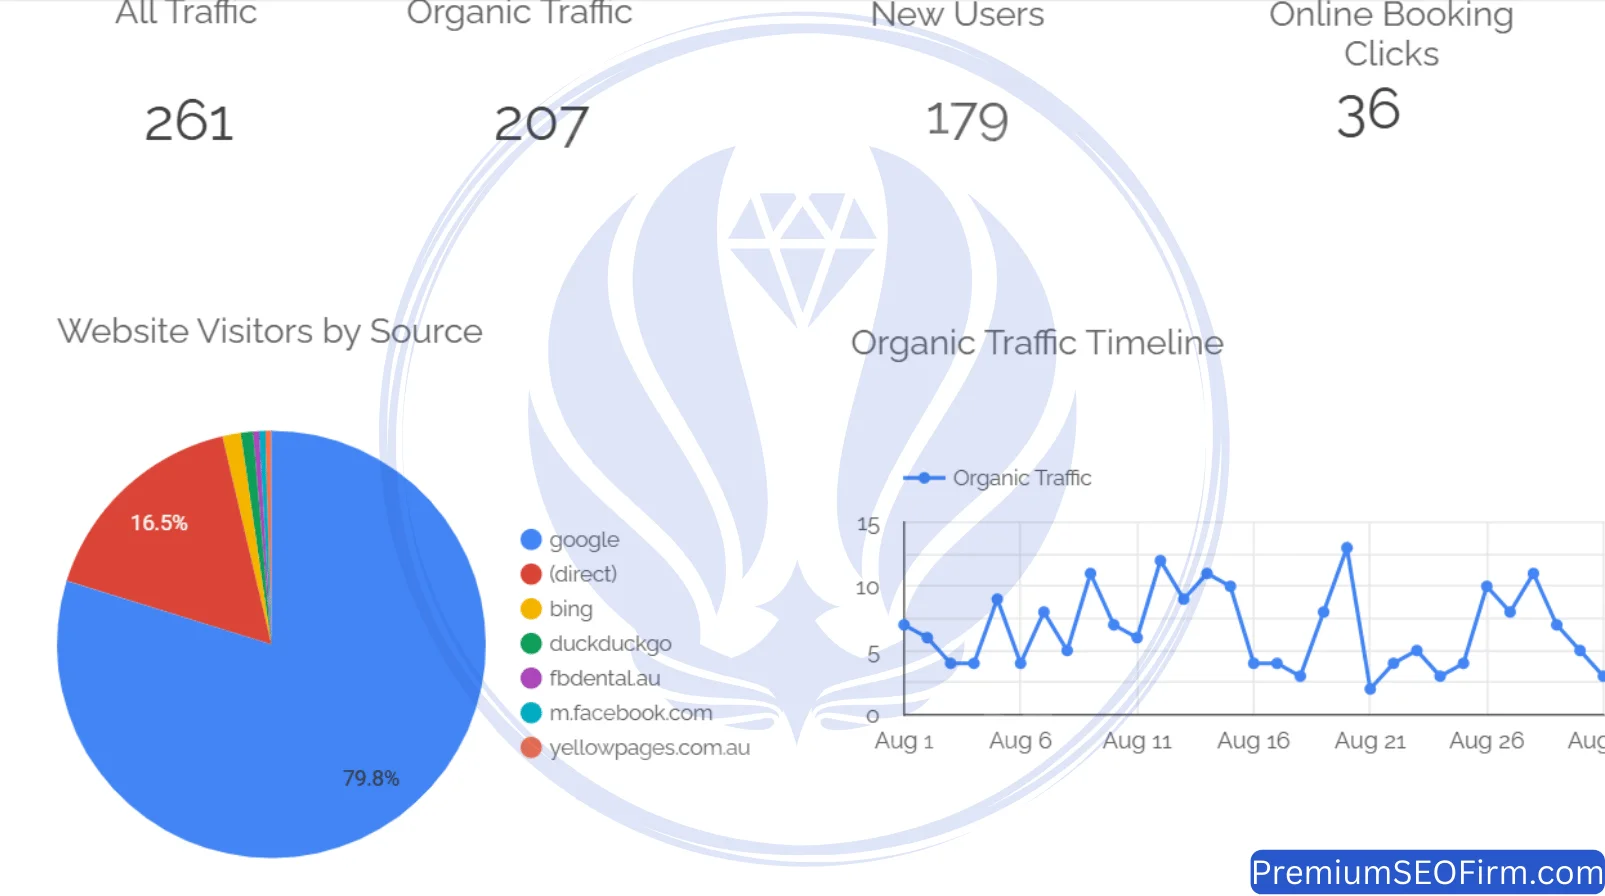
Traffic holding at 261 sessions through a major Google Core Update records that the technical foundation performed as designed. Sites with thin content or unresolved technical errors lost rankings during this update period. This site held, establishing that the Month 1 and Month 2 technical work created a stable base for the ranking growth that began in Month 4.
How Did the Google August 2024 Core Update Affect the Site?
The Google August 2024 Core Update rolled out from August 15 to September 3, 2024, and the site held at 261 sessions through the full rollout. The update targeted content quality across health-related websites. Pages built around keyword density rather than genuine patient usefulness lost rankings during the rollout period. The site was in its technical completion phase, and the technical and content foundations were aligned with what the update rewarded.
How Did CSS and JavaScript Performance Work Improve Load Speed?
CSS and JavaScript optimisation in Month 3 reduced page load times through 2 techniques: minification and script deferral. Minification removed unnecessary characters from code files, reducing file sizes and shortening load time. Script deferral delayed the loading of non-essential JavaScript until after the main page content appeared on screen, improving the Largest Contentful Paint score. LCP is the Core Web Vitals metric measuring how quickly the primary content loads. Both techniques produced measurable load time improvements on mobile devices, where local dental searches are conducted at the highest frequency.
Why Were Google Fonts Replaced With Self-Hosted Fonts?
Google Fonts were replaced with self-hosted fonts to remove a round-trip network request that added latency to every page load. The site was loading its typography from Google’s external font servers, adding a network request to each page load before any visible text appeared on screen. Self-hosted fonts are served directly from the practice’s own server, removing that round-trip delay entirely. The change reduced external resource requests per page load and contributed to the Core Web Vitals LCP improvements recorded in subsequent monthly audits.
How Did Canonical Tag Corrections Consolidate Ranking Authority?
Canonical tag corrections consolidated ranking authority onto the primary version of each page by resolving errors causing pages to compete against their own duplicates. Canonical tags tell Google which URL is the preferred version of a page when similar or identical content exists at multiple addresses, for example a page accessible at both www and non-www domain versions. Errors in canonical implementation split ranking authority between duplicate URL variants. The Month 3 audit identified and corrected all canonical errors across paginated and parameter-variant URLs within the reporting period.
Why Was the First Blog Article Published in Month 3?
The first blog article published in Month 3 used a question-format primary heading and delivered a complete direct answer within the first 40 words. The 40-word opening structure makes articles eligible for Google featured snippets, the highlighted answer boxes that appear above standard search results, and for citation in AI-generated responses from platforms including ChatGPT, Google Gemini, and Grok. The article targeted documented monthly search volume for patient-facing dental health questions in the Australian market. The article published simultaneously with a Google Business Profile post on the same day, creating 2 indexation entry points for the same topic.
How Did Suburb Page Optimisation Begin in Month 3?
Suburb page optimisation began in Month 3 with the Waterford West page as the first target. Waterford West is the closest geographic variation to the primary practice location and represented the fastest opportunity for additional first-page ranking coverage. The Waterford West page received a meta title update placing the suburb keyword within the first 30 characters, a heading hierarchy rebuild incorporating geographic keyword references at H2 and H3 level, geographic keyword additions to the body content, and LocalBusiness schema markup explicitly naming Waterford West in the service area declaration. The Ahrefs site health score and SiteChecker Pro score both reached 100 by the end of August, marking the completion of the technical foundation phase.
Why Was the Month 3 Traffic Consolidation Expected?
Month 3 traffic matching Month 2 at 261 sessions was a planned consolidation phase, not a stall. Technical completion work in Month 3 prepared the site’s architecture for the ranking improvements that began from Month 4 onward. Compounding SEO growth requires a period where foundational structural work completes before organic growth resumes. Traffic holding rather than dropping through the Google August 2024 Core Update confirmed the foundations were algorithmically sound before the content programme began producing ranking gains.
Month 4, September 2024: Perfect Technical Scores and Keywords Reaching Page One
What Were the Month 4 Traffic Results?
September 2024 recorded 283 total sessions and 247 organic sessions, a 19.3% organic traffic increase arriving immediately after the Google August 2024 Core Update completed its rollout. The table below shows September 2024 performance against August 2024 across 5 metrics.
| Metric | September 2024 | Month-on-Month Change |
|---|---|---|
| Total Sessions | 283 | +8.4% |
| Organic Sessions | 247 | +19.3% |
| New Users | 197 | +10.1% |
| Booking Clicks | 36 | Stable |
| Google Traffic Share | 79.5% | Stable |
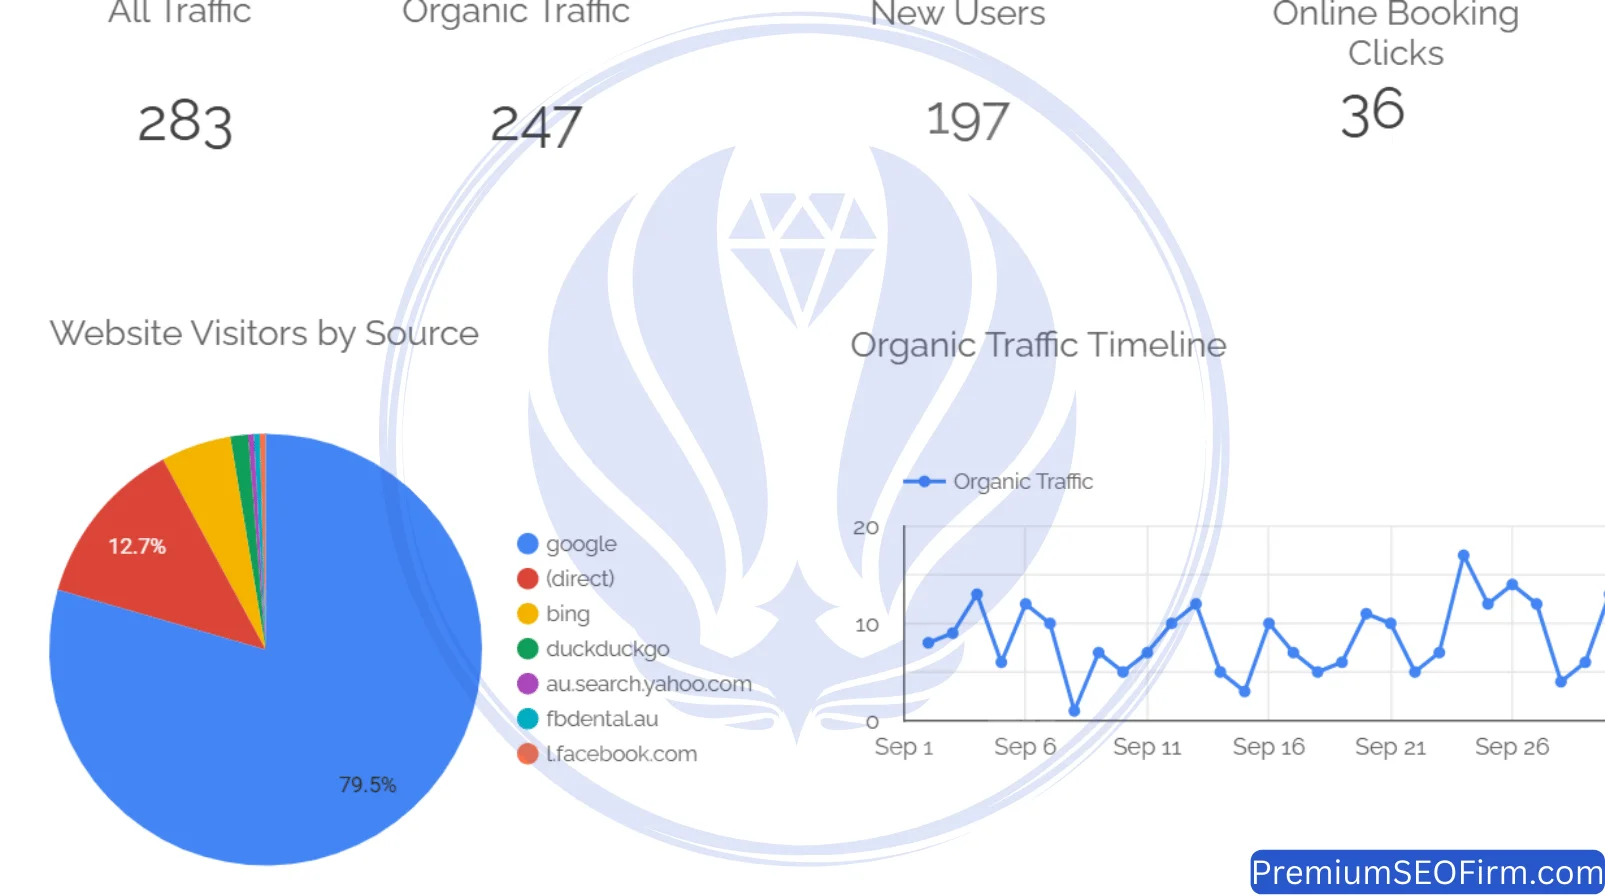
Sites built on proper technical and content foundations gained ranking ground when the August Core Update finished its rollout. Sites with unresolved deficiencies lost ground. The post-update organic traffic gain in September is the outcome of white hat foundations passing a Google algorithm quality assessment.
How Did Both Technical Audit Scores Reach 100 in Month 4?
Both the Ahrefs site health score and the SiteChecker Pro score reached 100 in the September 2024 audit rerun, recording zero outstanding technical errors across either platform. A score of 100 on both audit tools means zero detected crawl errors, zero broken internal links, zero canonical tag conflicts, zero missing meta elements, and zero structured data implementation errors. This technical milestone confirmed the 3-month foundation phase was complete and the site was in optimal condition for Google’s crawlers to index the growing content library without encountering obstacles.
How Did the Bethania Suburb Page Optimisation Improve Its Content Score?
The Bethania suburb page moved from a Surfer SEO content score of 58 to 73 in Month 4, a 15-point improvement representing the specific content, structural, and semantic elements separating this page from page-one competitors. A Surfer SEO content score comparison ran against the top 5 ranking pages for the Bethania dentist keyword. The 15 scoring points were recovered through semantic content term additions, heading hierarchy restructuring, geographic keyword improvements, and a new internal link network between suburb and treatment pages.
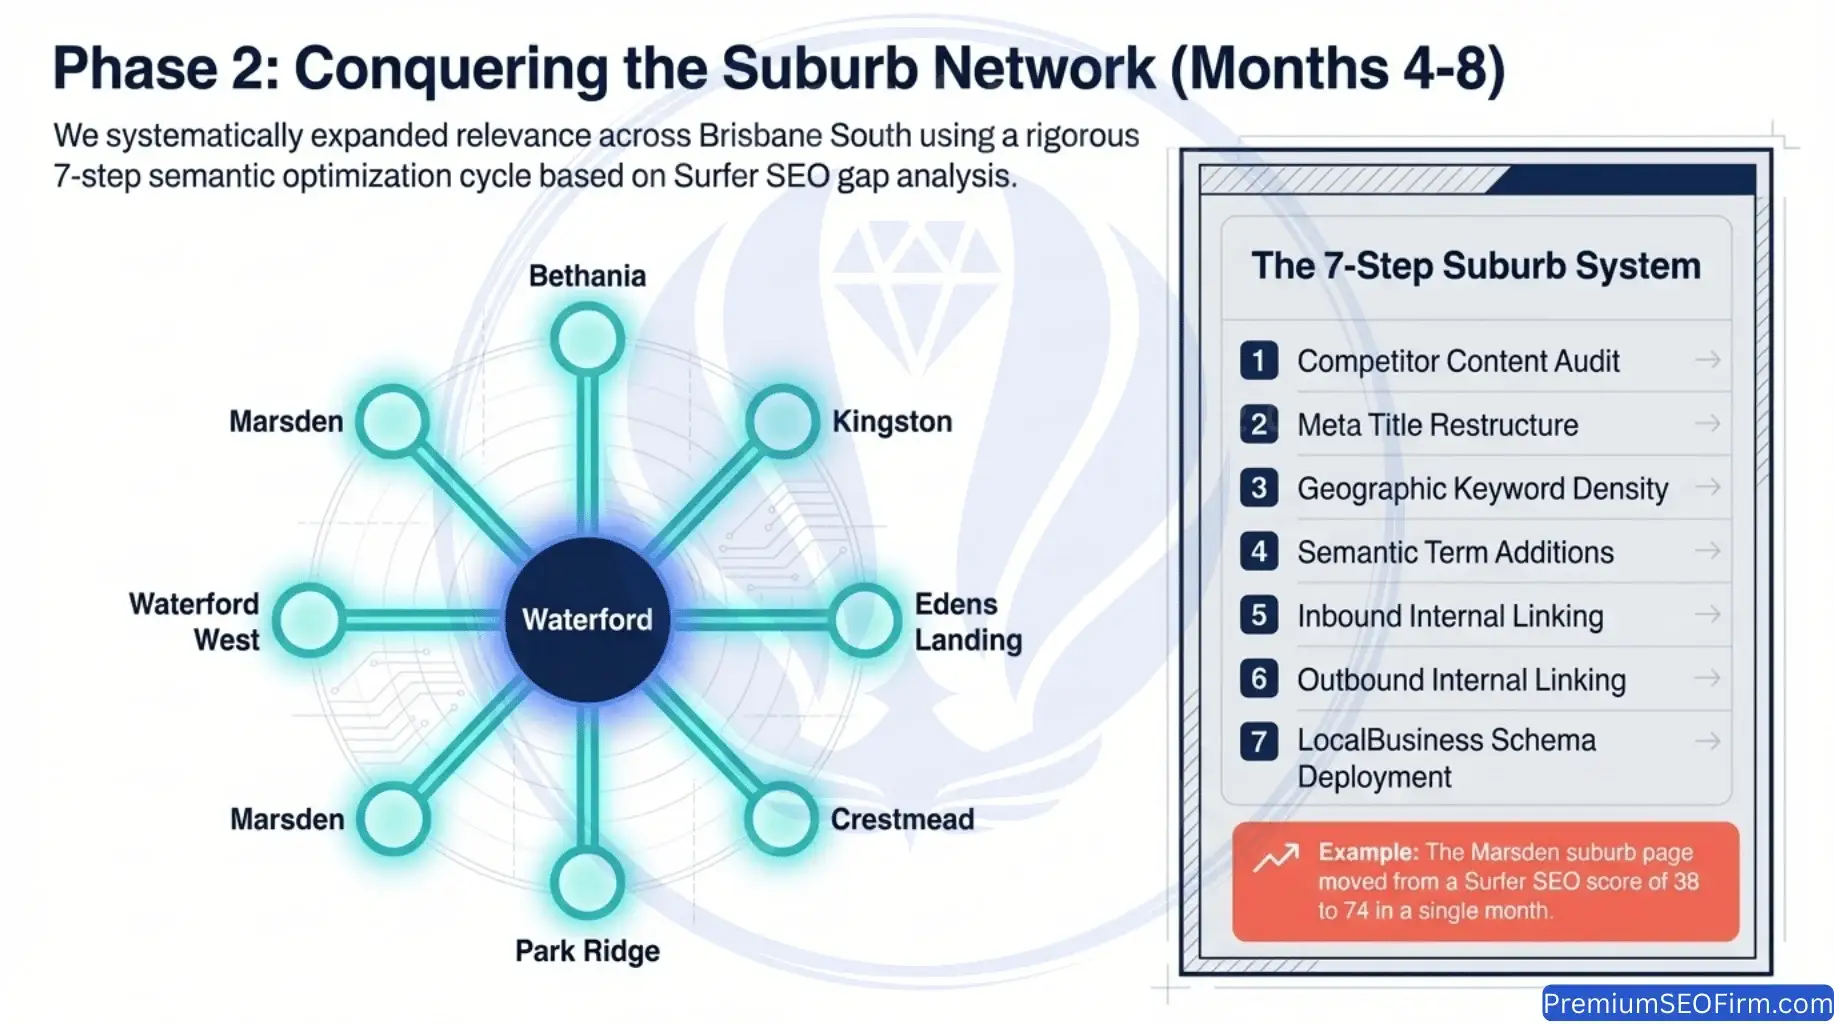
What Is the 7-Step Suburb Page Optimisation System?
The 7-step suburb page optimisation system addresses 3 primary ranking factor categories: content relevance, internal authority flow, and structured entity signals. The table below describes all 7 steps applied to every suburb page throughout the 14-month campaign. All 7 steps applied together produced the content score improvements and first-page rankings across the full suburb keyword set confirmed by Month 11.
| Step | What We Do |
|---|---|
| 1. Competitor Content Audit | Surfer SEO comparison against top-ranking pages for that suburb keyword |
| 2. Meta Title Update | Suburb keyword within first 30 characters, total length 50 to 60 characters |
| 3. Geographic Keyword Density | More natural mentions of suburb name and close variations throughout the page |
| 4. Semantic Term Additions | Related words and phrases that Google expects on a local dental page for this suburb |
| 5. Inbound Internal Links | Links from treatment pages to the suburb page using location-matched anchor text |
| 6. Outbound Internal Links | Links from the suburb page to relevant treatment pages |
| 7. LocalBusiness Schema | Schema markup added naming the suburb explicitly in the structured data service area |
Steps 1 through 4 address content relevance. Steps 5 and 6 address internal authority flow. Step 7 addresses structured entity signals. Applying all 7 steps consistently to each suburb page produced the first-page rankings across the full suburb keyword set confirmed by Month 11.
How Did Keyword Cannibalization Monitoring Begin in Month 4?
The first monthly keyword cannibalization patrol ran in September 2024 using Google Search Console query data and found no conflicts requiring intervention. Keyword cannibalization occurs when 2 or more pages on the same site compete for the same search query, splitting Google’s ranking focus between competing URLs and preventing either from ranking at full strength. The September patrol confirmed clean single-URL ranking signals for all primary keywords.
What Did the Monthly Blog Article and Google Business Profile Post Achieve?
The Month 4 blog article and Google Business Profile post published on the same day, creating 2 content entry points for the same topic. The article targeted a dental health question with documented monthly search volume in the Australian market. The article used question-format headings throughout and delivered a 40-word direct answer as the first paragraph under the primary H2 heading. The same-day Google Business Profile post signalled active business management, a confirmed local ranking signal in Google’s local search algorithm.
Month 5, October 2024: Six Keywords at Position 1 and 300 Sessions Crossed
What Were the Month 5 Traffic Results?
October 2024 recorded 320 total sessions and 45 booking clicks, the month in which the campaign crossed 300 total sessions for the first time and confirmed 6 primary keywords at position 1. The table below shows October 2024 results against September 2024 across 5 metrics.
| Metric | October 2024 | Month-on-Month Change |
|---|---|---|
| Total Sessions | 320 | +13% |
| Organic Sessions | 257 | +4% |
| New Users | 209 | +6.1% |
| Booking Clicks | 45 | +25% |
| Google Traffic Share | 77.4% | Diversifying traffic sources |
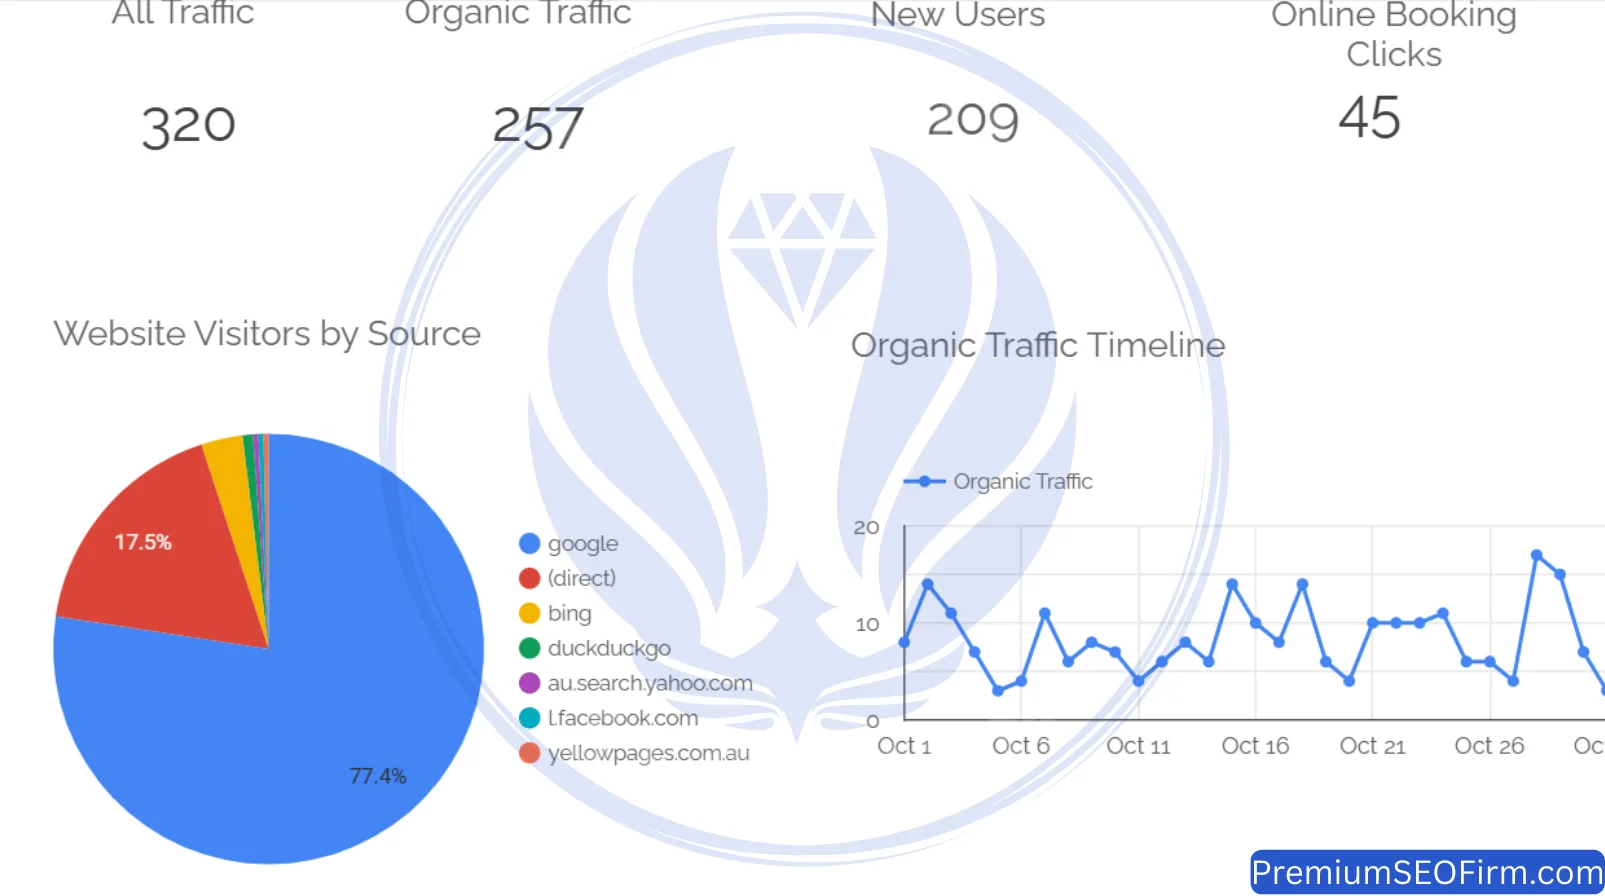
The Google traffic share dropping to 77.4% while total traffic grew is a positive data point. The share reduction means other search engines including Bing and DuckDuckGo were contributing a larger session volume. The online authority built in this campaign was spreading beyond single-channel dependence.
What Ranking Milestone Did Month 5 Confirm?
The October 2024 campaign review confirmed 6 primary location keywords at position 1 on Google, with 1 additional suburb keyword at position 2. Five months into the campaign, the practice had moved from 0 first-page rankings to position-1 rankings across its core keyword set. Technical corrections, treatment page optimisation cycles, and the suburb page programme together produced this outcome across 5 consecutive months of parallel work stream execution.
How Did the Edens Landing Suburb Page Optimisation Advance Rankings?
The Edens Landing suburb page entered the top 10 by October and received the full 7-step suburb optimisation as the Month 5 priority. The heading structure was rebuilt to reference Edens Landing multiple times in a natural content flow. Semantic terms from the Surfer SEO gap analysis were added to the page body. LocalBusiness schema was added, naming Edens Landing explicitly in the service area declaration. New internal links from the orthodontics and general dentistry treatment pages to the Edens Landing page expanded the authority flow network connecting treatment and suburb content.
How Did the Orthodontics Treatment Page Optimisation Address Its Content Gap?
The orthodontics page received its first full optimisation cycle in October, closing a content gap against the top-ranking pages for the orthodontics Waterford keyword through 4 actions. Missing semantic content terms were added to the page body. H2 and H3 headings were restructured to reference orthodontic treatment topics in logical topical order. The meta title was rewritten to place the orthodontics keyword within the first 30 characters. Service schema was added, explicitly declaring the orthodontics offering at the Waterford location.
What Did Google Search Console Data Confirm About Informational Keyword Growth?
Google Search Console query data for October 2024 confirmed growing impressions and clicks for informational keywords across 3 dental condition categories: broken teeth, gingivitis symptoms, and toothache treatment options. The blog content programme that began in Month 3 was generating informational search visibility for patient research queries. Patients arriving via these research queries engaged with the site at the awareness stage of the dental decision journey, the stage that precedes active appointment search and produces the highest lifetime patient value from initial acquisition.
Month 6, November 2024: The Google November Core Update and How the Site Handled It
What Were the Month 6 Traffic Results?
November 2024 recorded a modest traffic dip to 300 total sessions and 243 organic sessions, a decrease that was not a ranking loss. The table below shows November 2024 results against October 2024 across 5 metrics.
| Metric | November 2024 | Month-on-Month Change |
|---|---|---|
| Total Sessions | 300 | -6.3% |
| Organic Sessions | 243 | -5.4% |
| New Users | 200 | -4.3% |
| Booking Clicks | 38 | -15.6% |
| Google Traffic Share | 77.0% | Lowest of campaign |
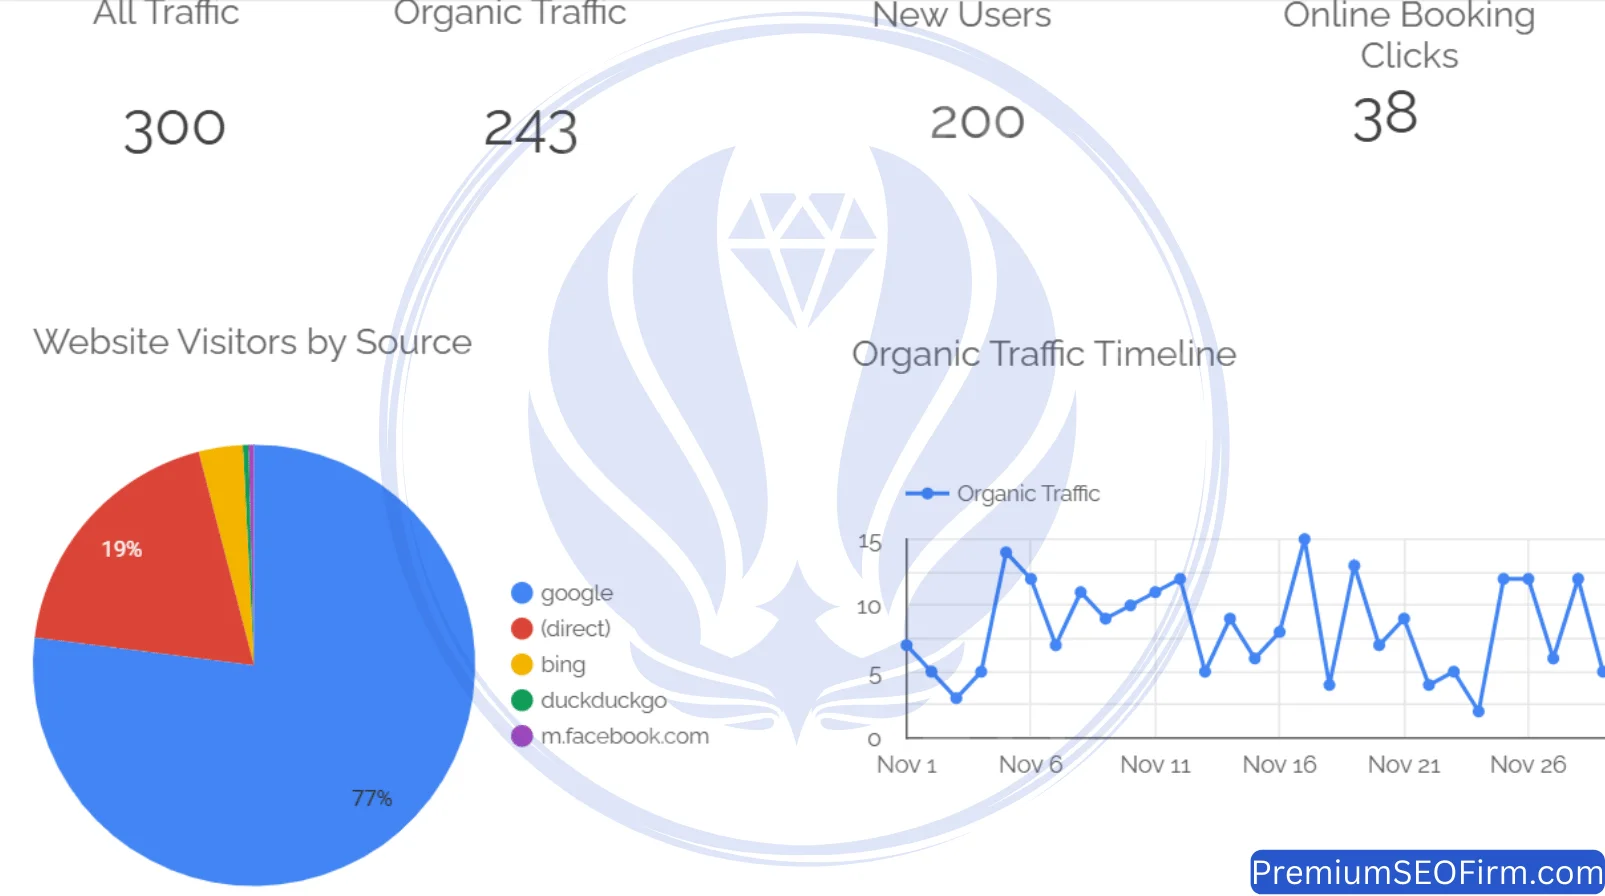
Google Search Console data confirmed that total keyword impressions across the tracked keyword set increased during November, meaning the site appeared in more search results than in October. Lower click volumes during update rollout periods record reduced search engagement across health and dental categories industry-wide. All first-position keywords held their positions throughout the November update rollout.
How Did the Google November 2024 Core Update Affect the Dental Search Market?
The Google November 2024 Core Update rolled out from November 11 to November 28, targeting whether content was written from genuine knowledge or primarily to rank for keywords. Dental sites with generic, template-generated content lost rankings during this rollout period. The content programme running since Month 3 produced patient-focused articles built from clinical accuracy and real dental procedure knowledge. Those quality signals aligned with what the update rewarded. All tracked keywords held first-page positions through the full rollout.
How Did Homepage Internal Link Strengthening Support Position-1 Maintenance?
Homepage internal link strengthening added 4 new equity signals from treatment pages to the homepage in November, using geo-modified anchor texts including “dental practice in Waterford” and “experienced dental team in Waterford.” These 4 new internal links increased topically relevant authority flowing to the homepage, reinforcing the homepage’s position-1 ranking for the primary dentist keyword through the update period and positioning the homepage for post-update traffic recovery in December.
How Did the Orthodontics Page Ranking Push Target Position 1?
The orthodontics page held position 2 entering November and received 3 targeted optimisation actions aimed at closing the position-1 gap. New semantic content terms from a fresh Surfer SEO analysis were added to the page body. H2 headings were restructured to include more natural references to orthodontic treatment variations. A new internal link from the homepage to the orthodontics page was added using anchor text closely matched to the page’s target keyword. These changes positioned the orthodontics page for position-1 movement in subsequent months.
What Was the Month 6 Disavow Programme Result?
6 toxic domains were added to the disavow file in November, the highest single-month removal total across the full campaign. The monthly Ahrefs new referring domains audit identified a surge in spam outreach activity during this period, with link farm operators targeting the domain. Removing these 6 domains from the active link profile prevented spam signal accumulation from affecting domain quality scores through the concurrent algorithm update period.
Month 7, December 2024: Full Recovery and 85.4% Google Share
What Were the Month 7 Traffic Results?
December 2024 recorded 347 total sessions and 294 organic sessions, a 21% organic traffic increase arriving immediately after the November Core Update completed its rollout. The table below shows December 2024 results against November 2024 across 5 metrics.
| Metric | December 2024 | Month-on-Month Change |
|---|---|---|
| Total Sessions | 347 | +15.7% |
| Organic Sessions | 294 | +21% |
| New Users | 251 | +25.5% |
| Booking Clicks | 33 | -13.2% (pre-holiday seasonal) |
| Google Traffic Share | 85.4% | Second-highest of campaign |
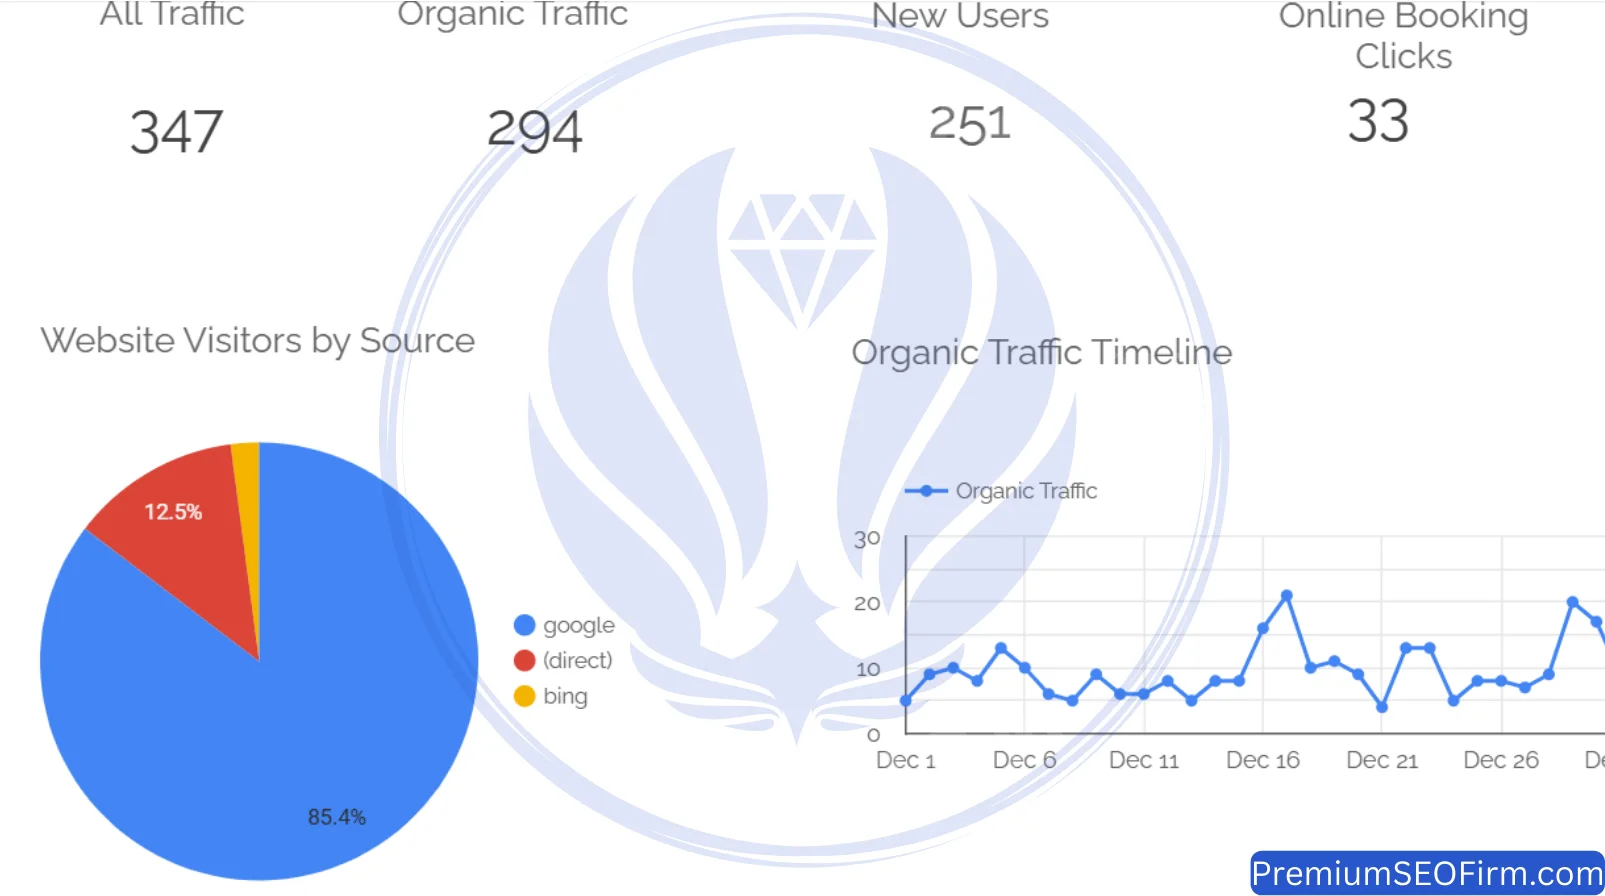
A 21% organic traffic increase from one month to the next, arriving immediately after an algorithm update rollout, records that the November dip was rollout volatility rather than structural ranking damage. The booking click reduction in December records the Australian dental market pre-holiday pattern, where patients defer non-urgent appointments until the new year. That demand reduction is unrelated to the site’s ranking positions.
What Does the 21% Organic Recovery Confirm About Update Impact?
Sites that hold rankings through an algorithm update and then grow immediately after record that the update caused temporary engagement suppression, not structural ranking damage. Sites built on technical or content shortcuts do not recover this way. Post-update suppression in those sites records permanent position losses because the update identified and corrected for the shortcuts. This site grew 21% the month after the November update because the update found no vulnerabilities to penalise.
What Did the 85.4% Google Traffic Share Indicate About Organic Dominance?
The December 2024 Google traffic share of 85.4% was the second-highest of the full 14-month campaign, recording that 297 of the 347 sessions that month originated from active Google search queries. Patients arriving from organic Google search queries for terms including “dentist Waterford” and related treatment keywords represent the highest-intent acquisition segment a local dental practice reaches. These patients are actively searching for a dentist at the exact moment of their booking decision.
How Did the Bethania Page Ranking Push Target the Top 3?
The Bethania suburb page held position 5 entering December and received a second optimisation pass targeting top-3 movement. A fresh Surfer SEO content score review identified additional semantic term opportunities not captured in the Month 4 optimisation cycle. New geographic keyword mentions were added to the body content referencing Bethania and its surrounding streets. A fresh internal link from the general dentistry treatment page to the Bethania page was added using location-specific anchor text. These changes addressed the content gap between position 5 and the top-3 positions that receive the majority of clicks for any local keyword.
What Did the Alt Text Audit and Fix Address?
The December technical audit identified images from Month 5 and Month 6 content additions that were missing alt text attributes. Alt text is the descriptive text attached to an image that communicates the image’s content to Google’s crawlers. Missing alt text creates 2 missed signals: the image-level keyword relevance signal the alt text carries, and the accessibility compliance signal that Google’s quality evaluation systems assess. All images without alt text were identified through the audit and received descriptive, keyword-inclusive alt text within the December reporting period.
Month 8, January 2025: Campaign Peak Booking Month and 400 Sessions Crossed
What Were the Month 8 Traffic Results?
January 2025 recorded 421 total sessions, 326 organic sessions, and 51 booking clicks, the highest single-month booking click total across all 14 campaign months. The table below compares January 2025 against December 2024 across 5 metrics: total sessions, organic sessions, new users, booking clicks, and Google traffic share.
| Metric | January 2025 | Month-on-Month Change |
|---|---|---|
| Total Sessions | 421 | +21.3% |
| Organic Sessions | 326 | +10.9% |
| New Users | 282 | +12.4% |
| Booking Clicks | 51 | +54.5% — Campaign Peak |
| Google Traffic Share | 78.8% | Diversifying across search engines |
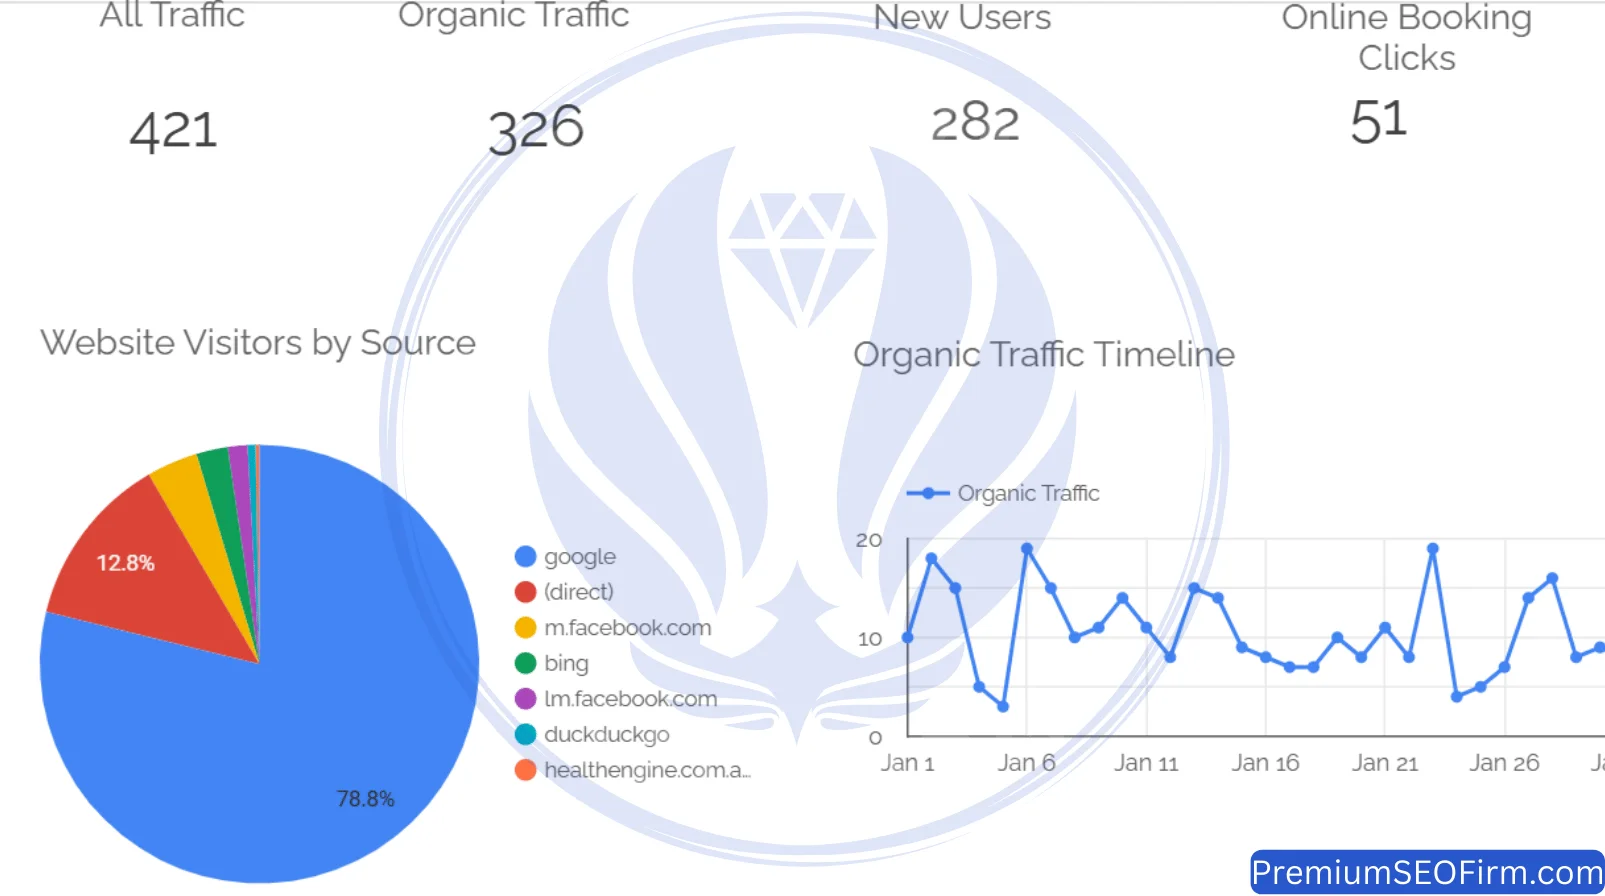
The 54.5% booking click increase outpaced the 21.3% session increase by 33.2 percentage points. Strong first-page rankings across the full keyword set, combined with well-structured treatment pages, converted January visitors into booking-intent patients at the highest rate of the campaign.
Why Did January 2025 Produce the Highest Booking Month of the Campaign?
January 2025 produced 51 online booking clicks because seasonal post-holiday demand met a site at full ranking maturity for the first time across the campaign. Australian patients who defer non-urgent dental appointments through the December holiday period return to booking mode in January. Post-holiday health commitments and the return of school and work schedules drive a surge in dental appointment search activity across the Brisbane south market. The practice held strong first-page positions across suburb and treatment keywords at the exact point when January demand peaked, a direct result of 8 months of consistent ranking work reaching maturity at the right seasonal moment.
What 3 Traffic Milestones Did January 2025 First Achieve?
January 2025 crossed 3 traffic milestones simultaneously, all confirmed in the same month for the first time in the campaign. The following table records the 3 milestones first achieved in January 2025 and the campaign month in which each was crossed.
| Milestone | First Achieved |
|---|---|
| 400 total sessions in one month | January 2025 — Month 8 |
| 300 organic sessions in one month | January 2025 — Month 8 |
| 50+ booking clicks in one month | January 2025 — Month 8 (51 clicks) |
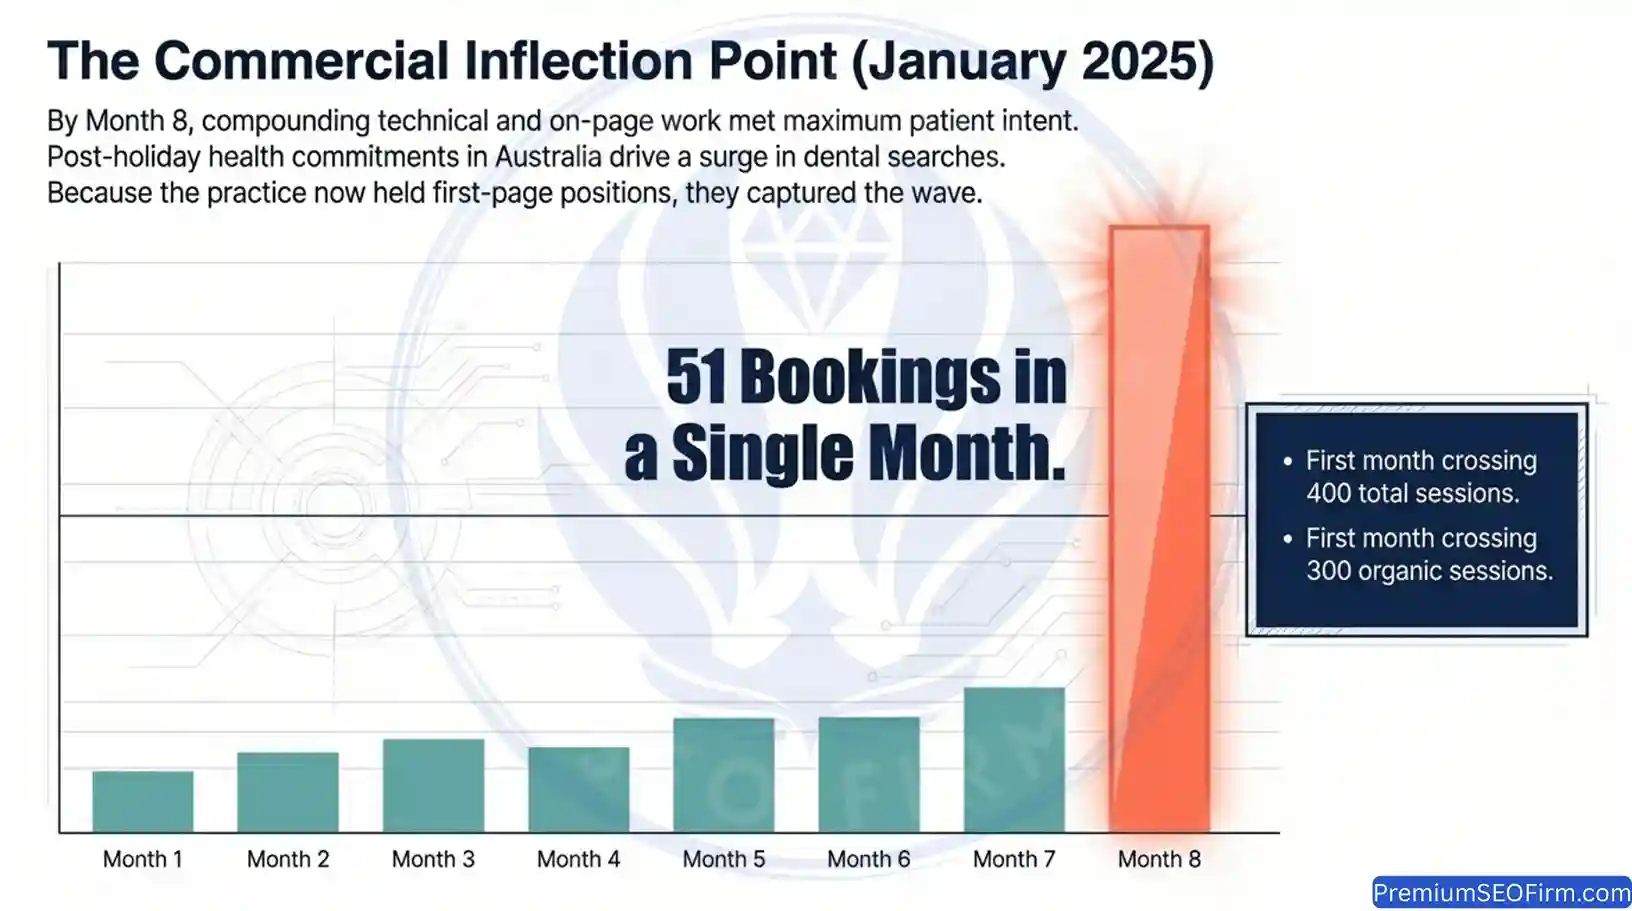
All 3 milestones arriving in the same month records that the site reached a performance threshold at Month 8 where every prior work stream was producing combined maximum return simultaneously. Session volume, organic quality, and conversion rate peaked together, reflecting the integrated nature of the 6-stream campaign architecture.
How Did the Crestmead Suburb Page Receive the Full 7-Step Optimisation Treatment?
The Crestmead suburb page received all 7 optimisation steps in January, including a complete heading hierarchy rebuild and LocalBusiness schema addition naming Crestmead explicitly in the service area data. New internal links were added from the dental implants and teeth whitening treatment pages to the Crestmead page. Reciprocal outbound links from the Crestmead page to those same treatment pages completed the bidirectional internal link structure for this suburb, reinforcing the topical authority connection between geographic and service content.
How Did the Sitewide Heading Hierarchy Audit Resolve Structural Errors?
The January sitewide heading hierarchy review identified 3 pages carrying H3 headings without a corresponding H2 parent heading, a structural error introduced during December content additions. H3 headings without parent H2 headings create a logical hierarchy break that prevents Google’s content structure parser from correctly identifying the H3 content’s topical relationship to the page’s primary subject. All 3 hierarchy errors were corrected within the January reporting period, restoring clean H1 to H2 to H3 structural logic across all affected pages.
Month 9, February 2025: Australian Summer Seasonal Dip and Suburb Scores Surge
What Were the Month 9 Traffic Results?
February 2025 recorded 354 total sessions and 285 organic sessions, a demand-side reduction consistent with the Australian back-to-school seasonal pattern recorded each year across the dental search market. The table below shows February 2025 results against January 2025 across 5 metrics.
| Metric | February 2025 | Month-on-Month Change |
|---|---|---|
| Total Sessions | 354 | -15.9% |
| Organic Sessions | 285 | -12.6% |
| New Users | 235 | -16.7% |
| Booking Clicks | 33 | -35.3% |
| Google Traffic Share | 79.7% | Stable |
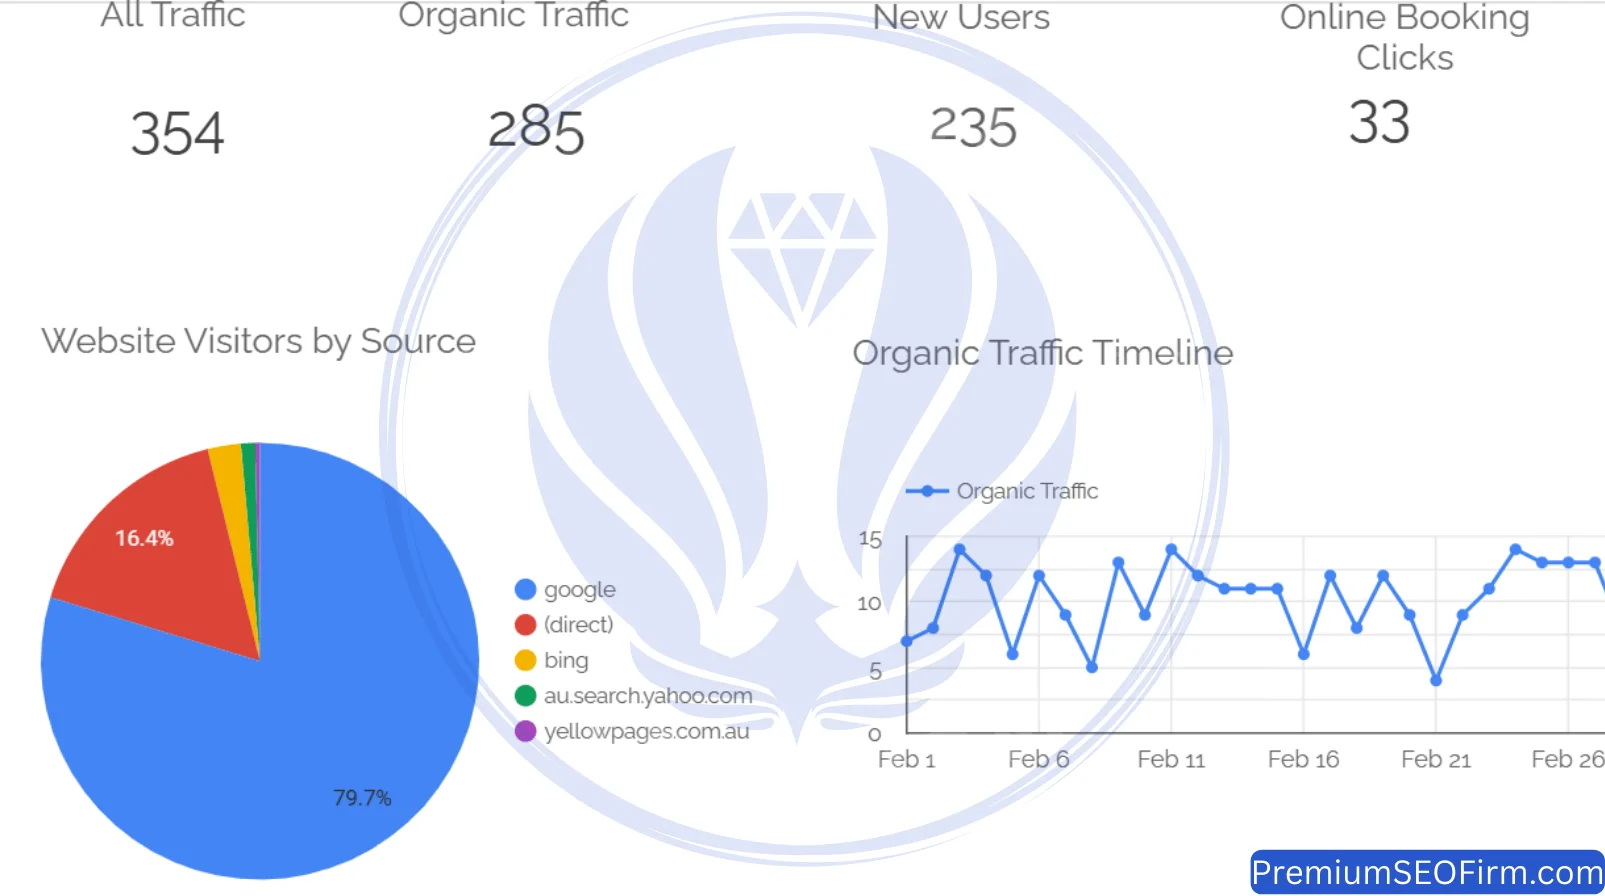
Google Search Console data confirmed that total keyword impressions across the tracked keyword set continued growing in February, meaning the site appeared in more searches than in January. The lower click volumes reflected a demand reduction affecting all dental search results in this period, not a change in the site’s ranking positions or a competitive position loss.
Why Did February Traffic Drop and Why Was That a Seasonal Pattern?
February in Australia marks the first back-to-school month of the year, and family budgets contract after the December and January holiday period, suppressing elective dental search volume industry-wide. Discretionary healthcare spending reduces at this point each year, producing a consistent, predictable search demand reduction across the Brisbane south dental market. All first-page positions held through February without change, positioning the site to capture returning demand from March onward without re-earning any ranking ground built across the prior 8 months.
How Did the Marsden Suburb Page Score Move From 38 to 74?
The Marsden suburb page moved from a Surfer SEO content score of 38 to 74 in Month 9, a 36-point improvement delivered through 8 sequential changes representing the most comprehensive single suburb page rebuild in the campaign. The 8 changes were: a complete meta title rewrite placing the Marsden keyword in the first 30 characters, a full heading hierarchy rebuild from scratch, a significant copy expansion adding all missing semantic terms from the Surfer SEO analysis, geographic keyword additions referencing Marsden and its surrounding area, new internal links from 3 treatment pages, external links to authoritative dental health references, LocalBusiness schema with Marsden named in the service area, and a new H2 section covering a content area that had been missing entirely from the original page structure. The 36-point improvement positioned the Marsden page for page-one ranking, confirmed at Month 12.
Why Did the Bethania Page Require a Second Optimisation Cycle?
The Bethania page required a second optimisation cycle because the page had reached position 3 following the Month 4 work but plateaued there rather than continuing upward toward the top 2 positions. The pre-second-cycle Surfer SEO score was 58. Additional semantic term additions and a heading restructure brought the score to 73. The plateau at position 3 after the first cycle indicated residual content gaps the initial work had not fully closed, gaps the second cycle identified and addressed to provide the additional content signal needed to push beyond position 3.
Month 10, March 2025: The March Core Update, 8% Organic Growth, and ChatGPT Arrives
What Were the Month 10 Traffic Results?
March 2025 recorded 366 total sessions, 308 organic sessions, and 8.1% organic traffic growth during the full rollout of the Google March 2025 Core Update. The table below shows March 2025 results against February 2025 across 5 metrics, including the first month in which ChatGPT.com appeared as a confirmed referral source.
| Metric | March 2025 | Month-on-Month Change |
|---|---|---|
| Total Sessions | 366 | +3.4% |
| Organic Sessions | 308 | +8.1% |
| New Users | 271 | +15.3% |
| Booking Clicks | 29 | -12.1% |
| Google Traffic Share | 85.2% | Strong organic dominance |
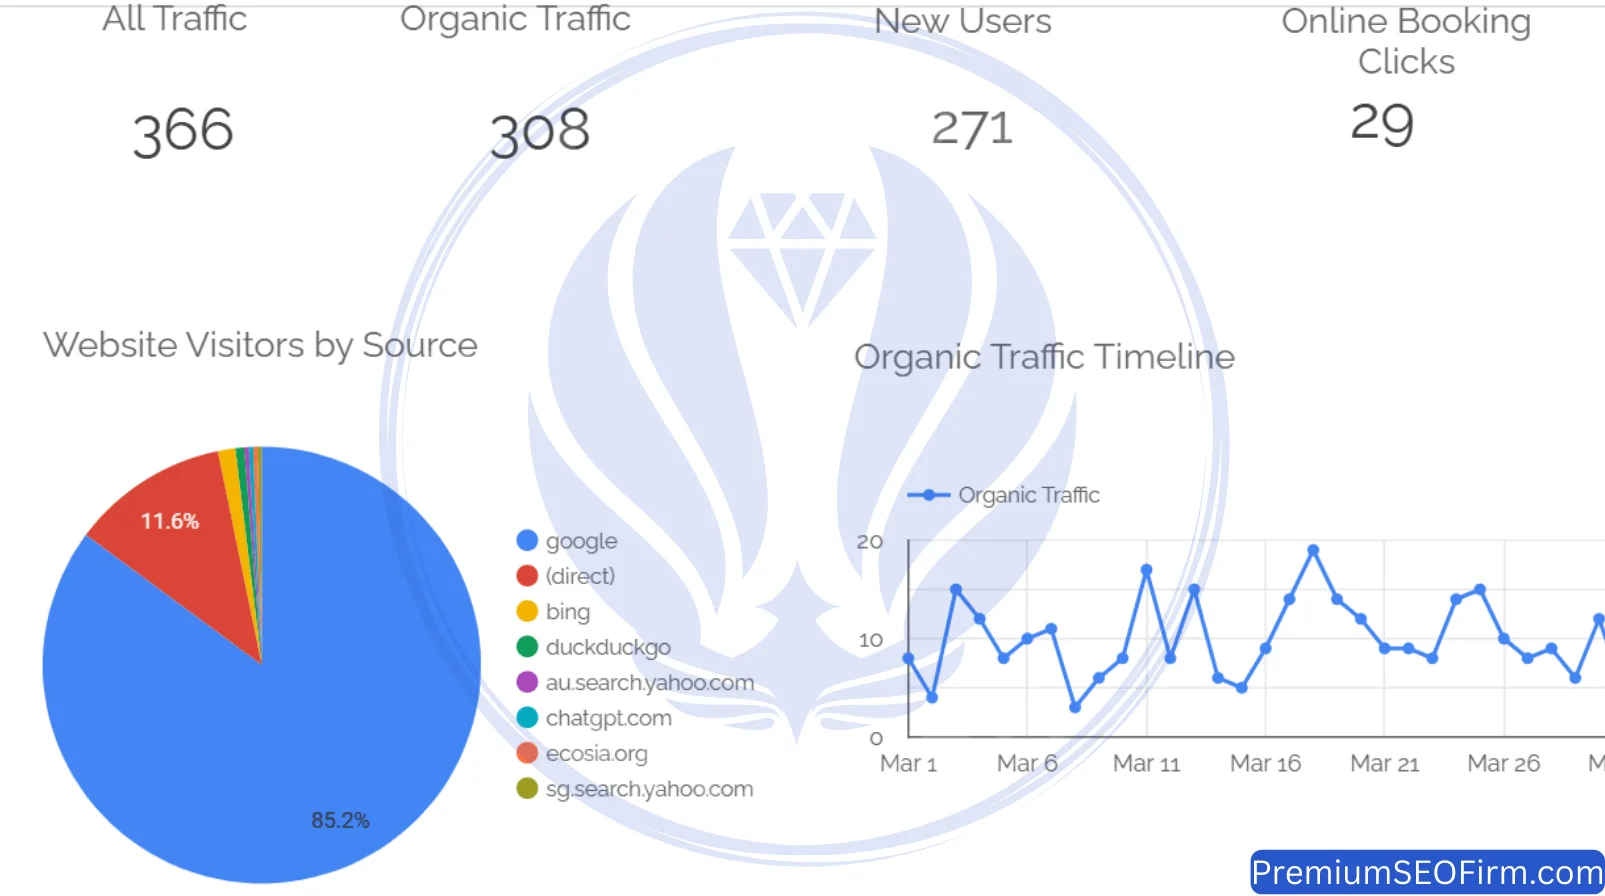
Organic traffic growth of 8.1% and new user growth of 15.3% during a major Google Core Update records that the site’s content quality aligned with what the update rewarded. The booking click reduction in March reflects update rollout period engagement suppression in health categories, a temporary pattern consistent with the November 2024 update behaviour, where booking clicks recovered fully the month after the update completed.
How Did the Google March 2025 Core Update Affect Rankings?
The Google March 2025 Core Update rolled out from March 13 to March 27, 2025, elevated content demonstrating genuine first-hand expertise, and all 13 tracked keywords maintained first-page positions through and after the full rollout. The update penalised content written without real expertise in the topic. The content programme running since Month 3, built around clinically accurate dental information written with real procedural knowledge, aligned directly with the quality signals the update was designed to reward.
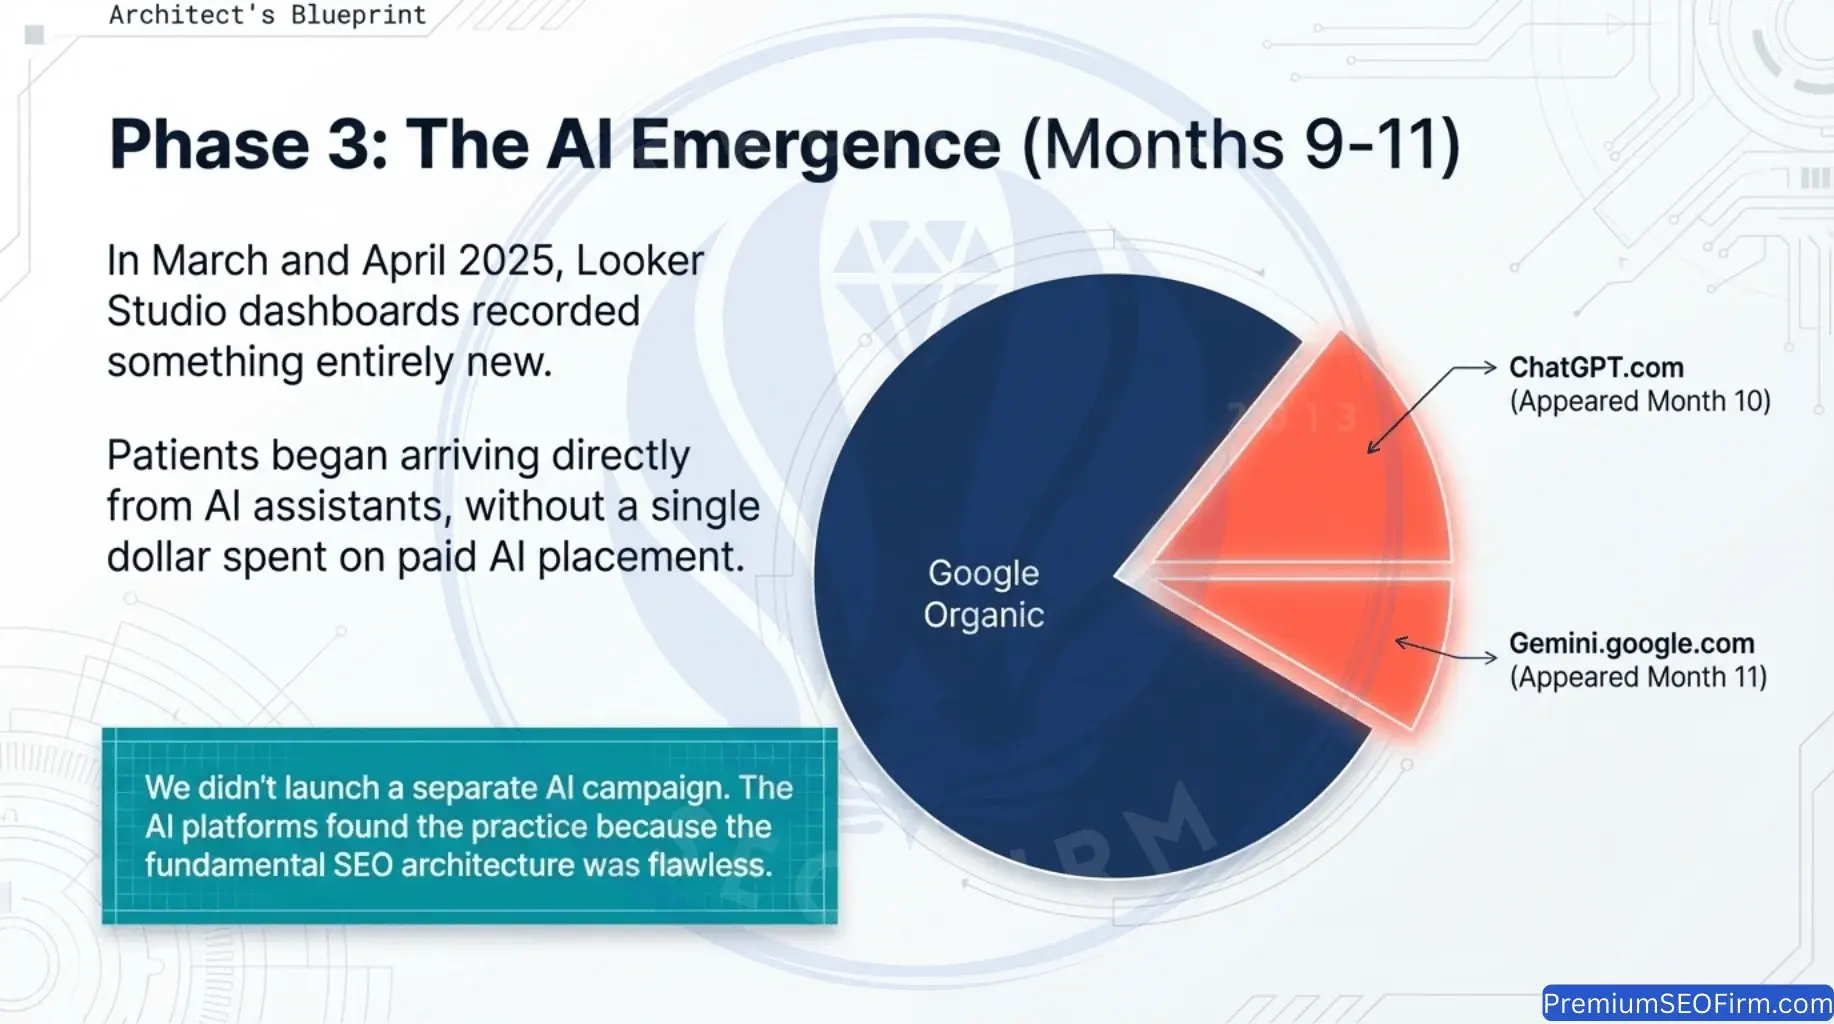
Why Did ChatGPT Appear as a Referral Source in Month 10?
Google’s data visualisation platform Looker Studio showed ChatGPT.com as a confirmed referral source for the first time in the March 2025 campaign data, appearing alongside 7 other traffic sources without paid activity in the ChatGPT channel. The March 2025 Looker Studio referral source breakdown showed 8 distinct traffic sources: Google at 85.2%, direct traffic, Bing, DuckDuckGo, Yahoo, SG.Search.Yahoo.com, Ecosia, and ChatGPT.com.
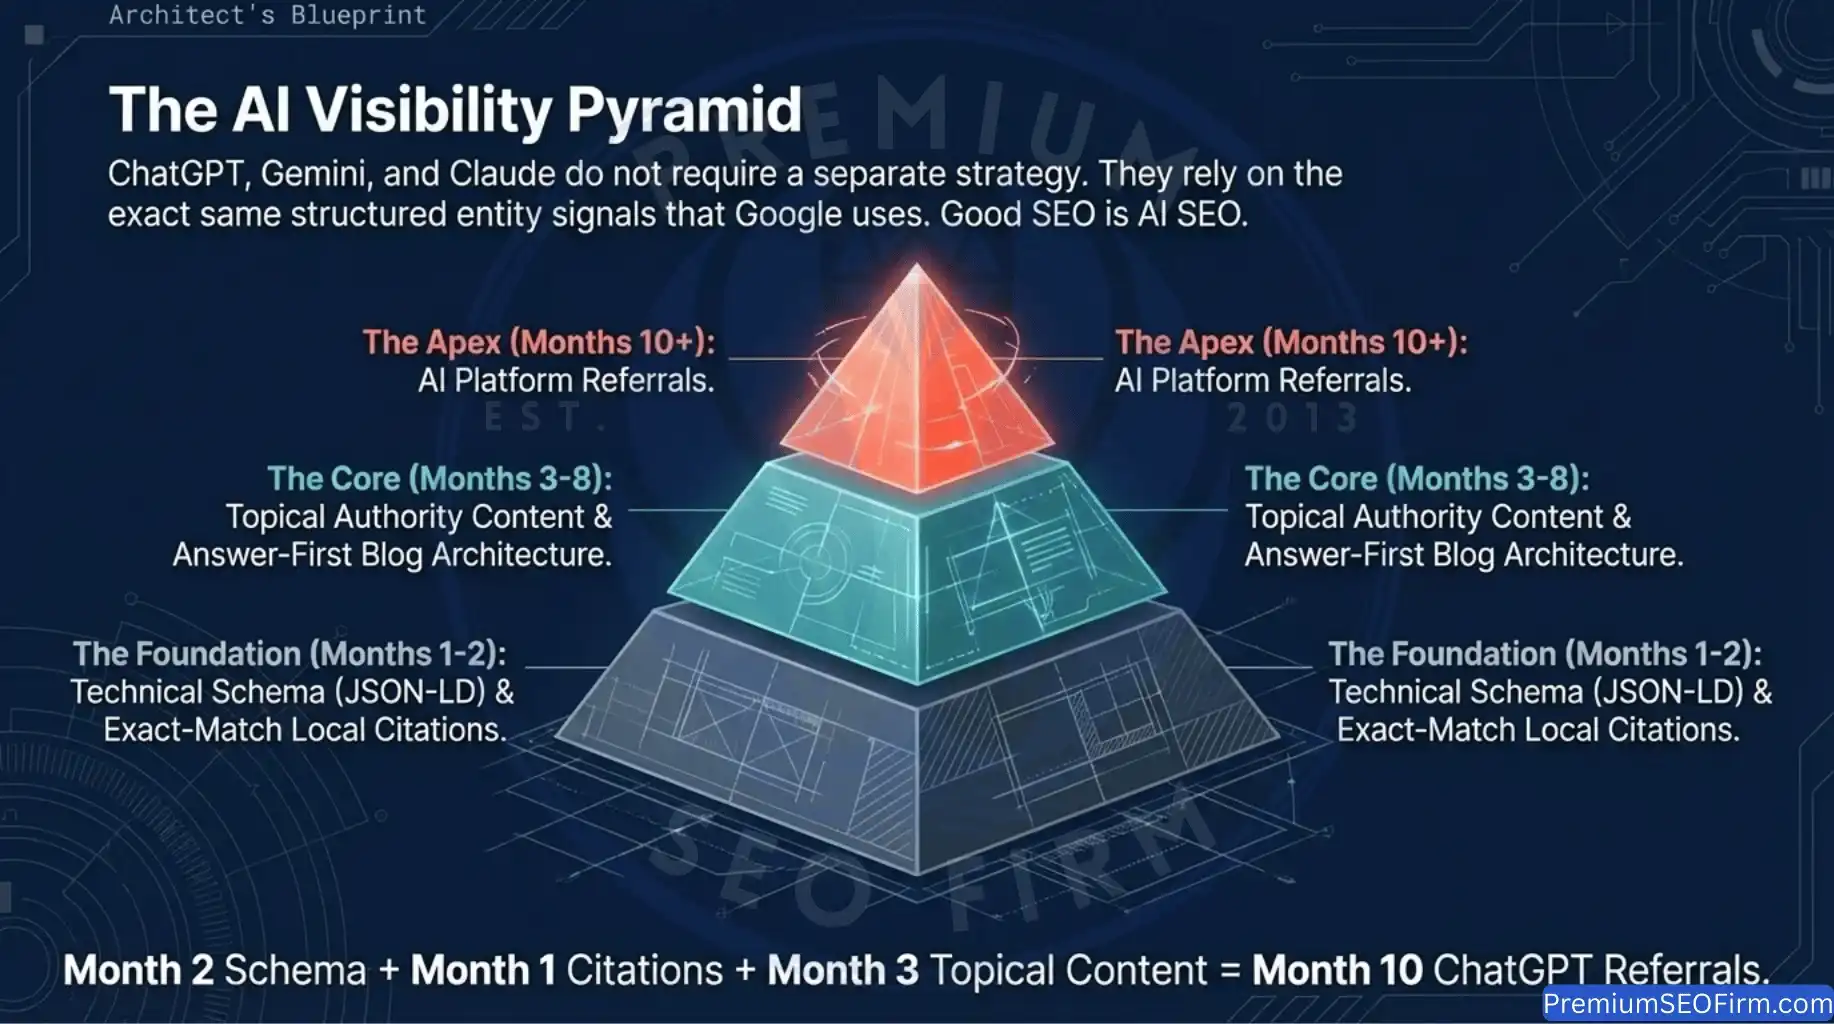
ChatGPT referral traffic confirmed in Month 10 because the schema markup deployed from Month 2, citation listings built from Month 1, and content depth accumulated from Month 3 had collectively crossed the structured entity signal threshold that AI recommendation platforms require. ChatGPT (OpenAI), Google Gemini (Google DeepMind), Grok (xAI), and Claude (Anthropic) all use the same structured data signals and entity consistency indicators that Google uses for organic ranking. Building those signals for Google rankings simultaneously builds them for AI platform visibility, without a separate AI optimisation programme.
What On-Page and Off-Page Work Ran in Month 10?
The Park Ridge and Kingston suburb pages both received the full 7-step optimisation treatment in March, with both pages holding top-10 rankings entering the month and identified for first-page consolidation. Each page received a meta title update, geographic keyword additions, semantic term improvements from a fresh Surfer SEO analysis, new internal links from relevant treatment pages, and LocalBusiness schema additions naming their respective suburbs in the structured data service area declaration. In addition, 5 toxic domains were added to the disavow file, and 9 new citation listings were submitted across Australian local and health directories, continuing the consistent NAP-matched citation building programme established in Month 2.
Month 11, April 2025: All 13 Keywords on Page One and Google Gemini Arrives
What Were the Month 11 Traffic Results?
April 2025 recorded 410 total sessions, 330 organic sessions, and 43 booking clicks, the month in which the campaign achieved 100% first-page keyword coverage across all 13 tracked terms and Google Gemini confirmed as a second AI referral source. The table below shows April 2025 results against March 2025 across 5 metrics.
| Metric | April 2025 | Month-on-Month Change |
|---|---|---|
| Total Sessions | 410 | +12% |
| Organic Sessions | 330 | +7.1% |
| New Users | 282 | +4.1% |
| Booking Clicks | 43 | +48.3% |
| Google Traffic Share | 80.3% | Stable with multi-source diversity |

The 48.3% booking click increase alongside steady traffic growth records that full first-page keyword coverage translates directly into patient enquiry volume. First-page positions across all 13 tracked terms eliminate competitor-preference leakage in search results. Every patient searching any tracked term encounters this practice before competitors positioned on page two.
What Ranking Milestone Did Month 11 Achieve?
The April 2025 campaign review confirmed all 13 tracked keywords ranking within the top 10 on Google, representing 100% first-page coverage achieved 11 months from a starting point of 0 first-page rankings. The progression from 0 to 13 first-page keywords required consistent suburb page optimisations, treatment page improvement cycles, technical maintenance across both audit platforms, and a content depth programme operating in parallel across all 11 months. No single month or single tactic produced this outcome.
When Did Google Gemini Confirm as a Second AI Platform Referral Source?
The April 2025 Looker Studio referral source data confirmed Gemini.google.com as a second AI platform traffic source, appearing alongside ChatGPT.com in the same monthly report. Both major AI assistant platforms, ChatGPT (OpenAI) and Google Gemini (Google DeepMind), were simultaneously sending patient visits to the practice without paid activity in either channel. The full April traffic source breakdown showed 8 sources: Google at 80.3%, direct traffic, Bing, DuckDuckGo, Yahoo, AU.Search.Yahoo.com, Gemini.google.com, and ChatGPT.com.
How Was Keyword Cannibalization Resolved in Month 11?
The monthly Google Search Console patrol in April identified a cannibalization conflict between 2 pages competing for the primary dentist keyword, requiring a 5-step resolution to consolidate ranking authority onto a single designated URL. The 5 steps were: an anchor text audit across all competing pages, internal link updates directing equity from competing pages to the designated ranking URL, removal of competing keyword references from the non-target page’s body copy and heading structure, a meta title update on the non-target page removing the overlapping keyword, and ongoing Google Search Console impression monitoring in subsequent months to confirm the resolution held. The fix supported position-1 maintenance for the primary keyword through all remaining campaign months.
Month 12, May 2025: The Campaign’s Peak Month Across Every Traffic Metric
What Were the Month 12 Traffic Results?
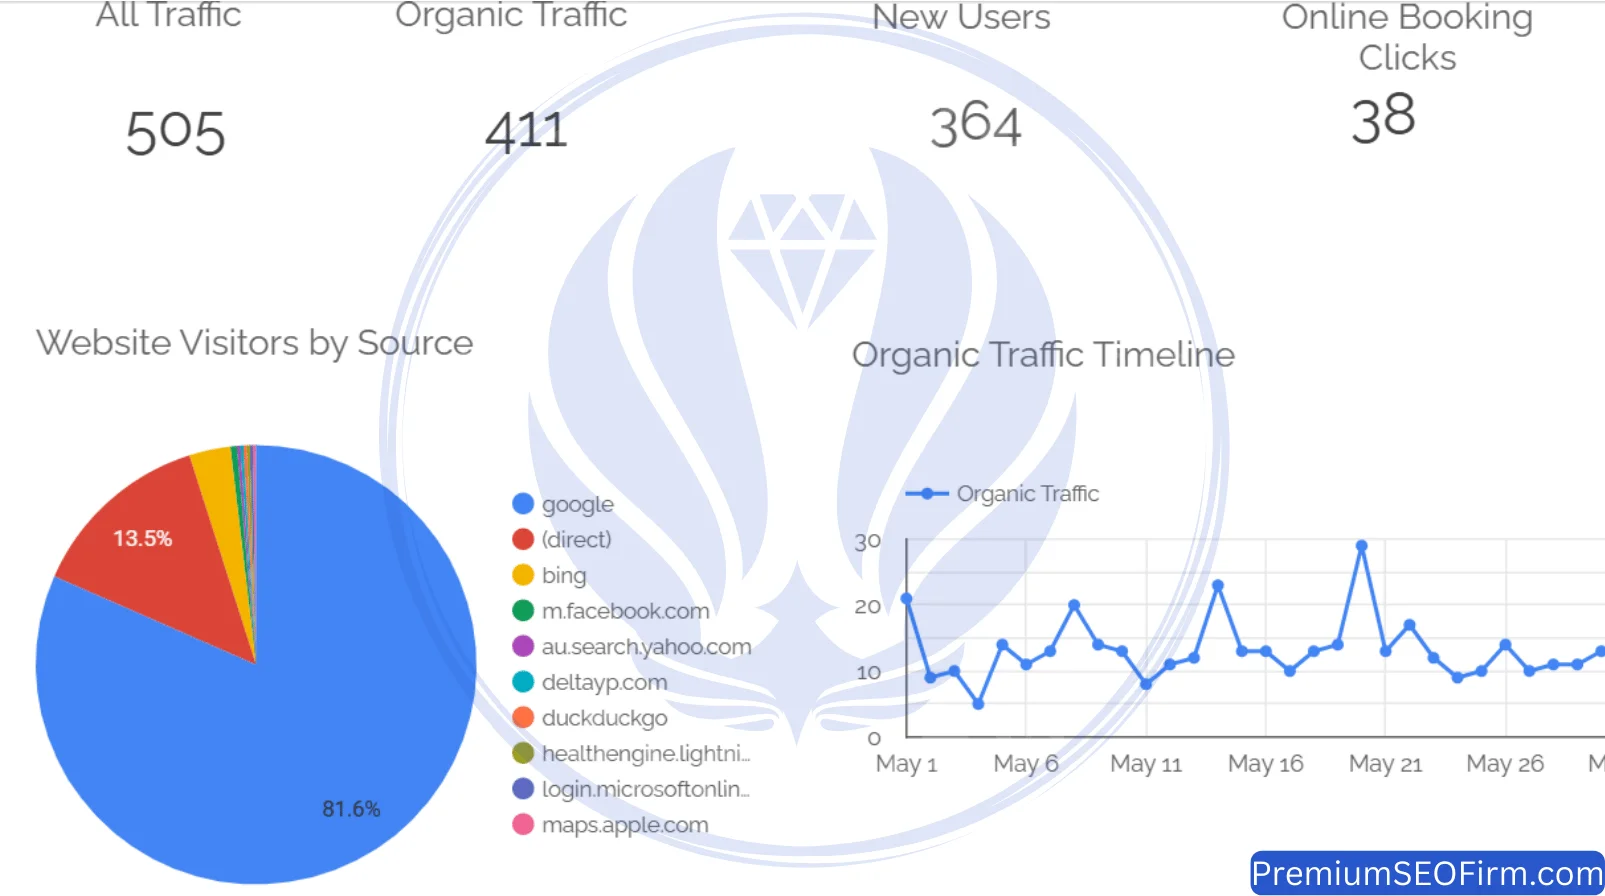
May 2025 recorded 505 total sessions, 411 organic sessions, and 364 new users, the highest figures across all 3 metrics for the entire 14-month campaign. The table below shows May 2025 results against April 2025 across 5 metrics.
| Metric | May 2025 | Month-on-Month Change |
|---|---|---|
| Total Sessions | 505 | +23.2% — Campaign Peak |
| Organic Sessions | 411 | +24.5% — Campaign Peak |
| New Users | 364 | +29.1% — Campaign Peak |
| Booking Clicks | 38 | -11.6% |
| Google Traffic Share | 81.6% | Consistent organic strength |
The campaign peak arrived at the 12-month mark, the point at which 12 months of compounding work across 6 parallel streams produced the fullest combined effect. All 13 keywords held page-one positions. Both AI platforms were sending referrals. The citation profile had grown to 25+ listings. The blog content library held 11 published articles building topical authority. The technical foundation maintained perfect scores on both audit platforms. Every work stream was producing at full operational maturity simultaneously.
Why Did May 2025 Produce Record Traffic Numbers?
May 2025 was the 12-month anniversary of the campaign, and compounding SEO growth means each month’s work builds on a stronger foundation than the month before, producing proportionally greater returns as the foundation accumulates depth. At Month 12, the site carried a full year of accumulated technical cleanliness, content depth, citation authority, and on-page optimisation all operating together at scale. No single element produced the record month. The record month was the product of every element working in combination at full maturity: technical precision from Month 1, content depth from Month 3, suburb ranking authority from Months 4 through 10, and AI platform signals from Month 10 onward.
What 4 Milestones Did May 2025 First Achieve?
May 2025 confirmed 4 performance milestones simultaneously at the 12-month mark, each representing a distinct dimension of accumulated campaign work reaching its full output. The table below records the 4 milestones first achieved in May 2025 and the campaign month each was confirmed.
| Milestone | First Achieved |
|---|---|
| 500 total sessions in one month | May 2025 — Month 12 (505 sessions) |
| 400 organic sessions in one month | May 2025 — Month 12 (411 sessions) |
| 360+ new users in one month | May 2025 — Month 12 (364 new users) |
| 9 distinct traffic sources in one month | May 2025 — Month 12 |
Session volume from sustained rankings, organic quality from content authority, user growth from expanded geographic keyword coverage, and source diversity from the full citation and schema programme all peaked in the same month. The 4 milestones confirm that integrated campaign architecture produces integrated performance outputs at maturity, not isolated gains in single metrics.
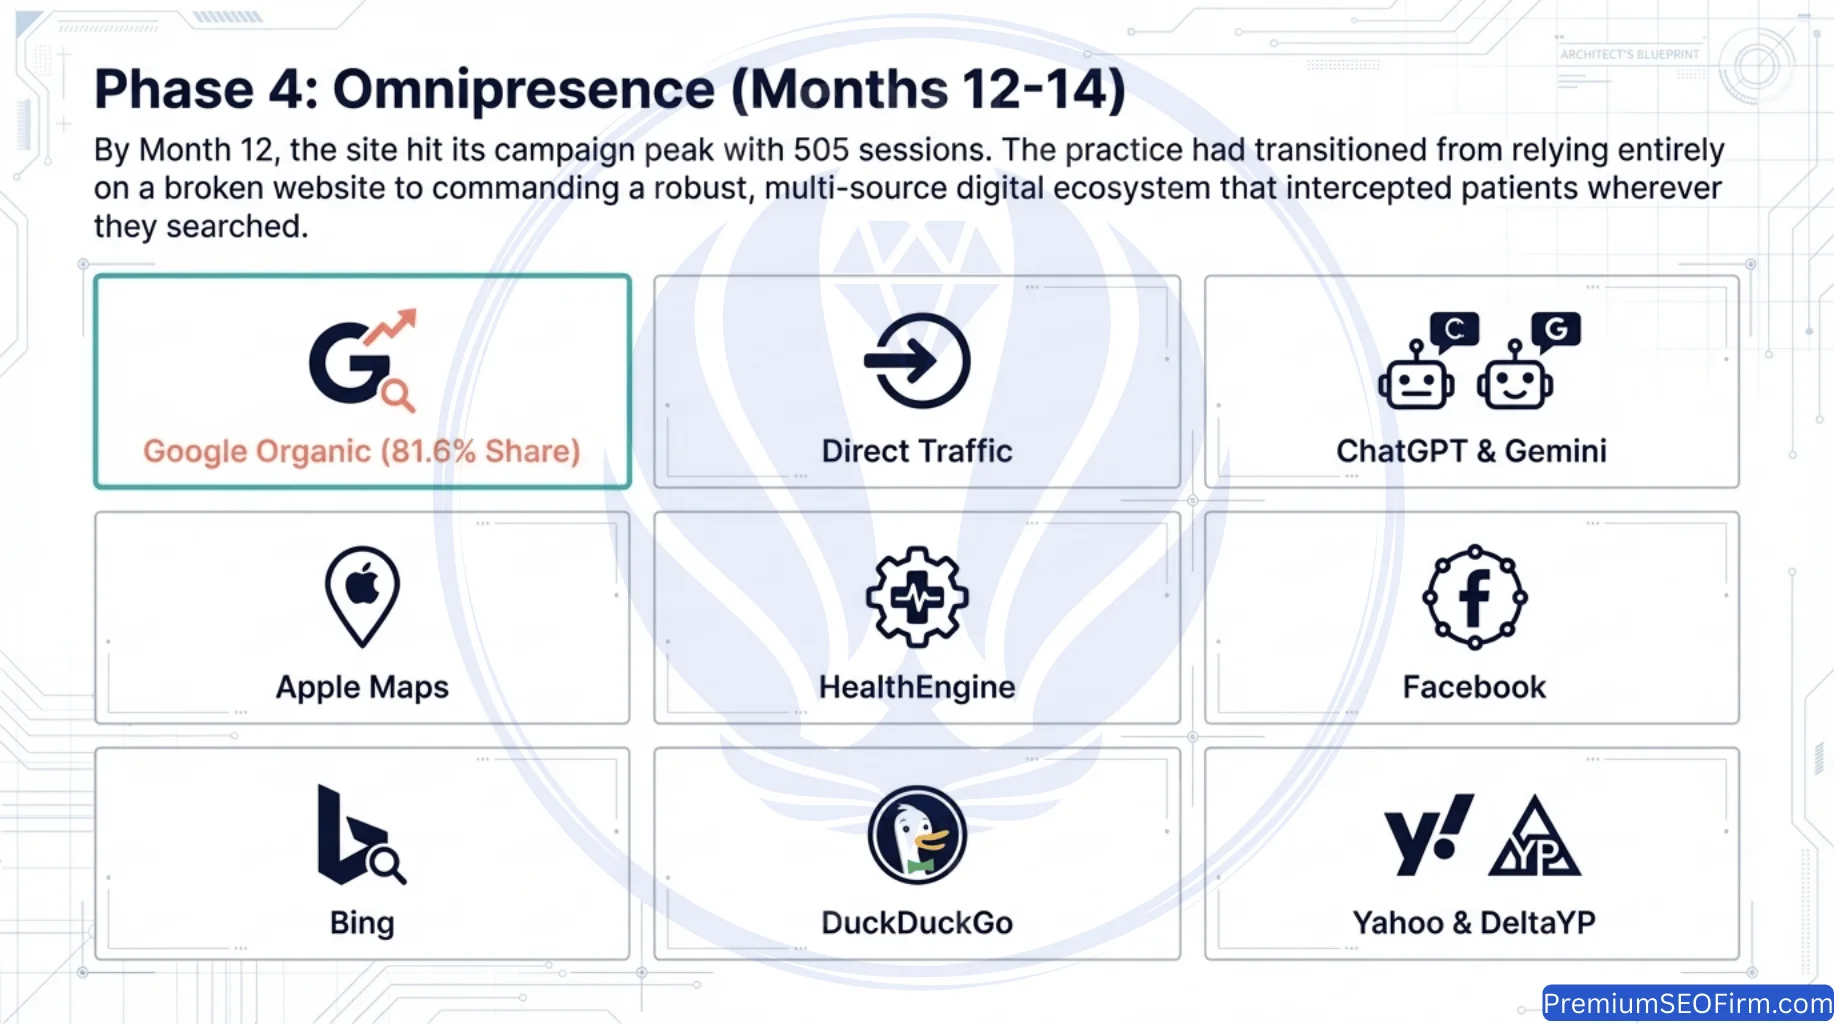
What 9 Traffic Sources Did Looker Studio Confirm in May 2025?
The May 2025 Looker Studio website visitors by source breakdown confirmed 9 separate traffic sources: Google at 81.6%, direct, Bing, Facebook, Yahoo, DeltaYP, DuckDuckGo, HealthEngine, and Apple Maps. Every citation listing submitted across 12 months contributed a distinct visibility signal across the channels where patients search for local dental care. The 9-source traffic profile is the measurable output of a complete local SEO programme. Each source represents a channel where the practice’s NAP consistency, structured data accuracy, and content quality signals had reached recommendation threshold.
How Did the Marsden Page First-Page Confirmation Validate the Month 9 Optimisation?
The May 2025 campaign review confirmed the Marsden suburb page at a page-one position, the direct outcome of the 36-point Surfer SEO score improvement delivered in Month 9 and the internal link network additions applied in February and March. The Marsden page had held a low-ranking position before the Month 9 rebuild. The 36-point score improvement, combined with 3 months of ranking signal consolidation, produced page-one movement by Month 12. The Marsden trajectory confirms a consistent pattern across this campaign: comprehensive suburb page optimisation produces page-one results within 2 to 3 months of implementation when all 7 optimisation steps are applied together.
What Was the Month 12 Blog Article Topic?
May’s blog article covered dental crown cost factors in Australia, targeting patients in the active research stage of the crown treatment decision, a query type that carries high booking intent. A patient searching for dental crown costs in Australia is actively evaluating the treatment, placing that visitor within 1 to 2 search sessions of booking a consultation. The article delivered a complete direct answer in the first 40 words of the opening section, linked to the crowns and bridges treatment page using the treatment name as anchor text, and built topical authority for the commercial page while serving the informational need of the research-stage patient simultaneously.
Month 13, June 2025: Year-Over-Year Comparison Confirms Real Growth
What Were the Month 13 Traffic Results?
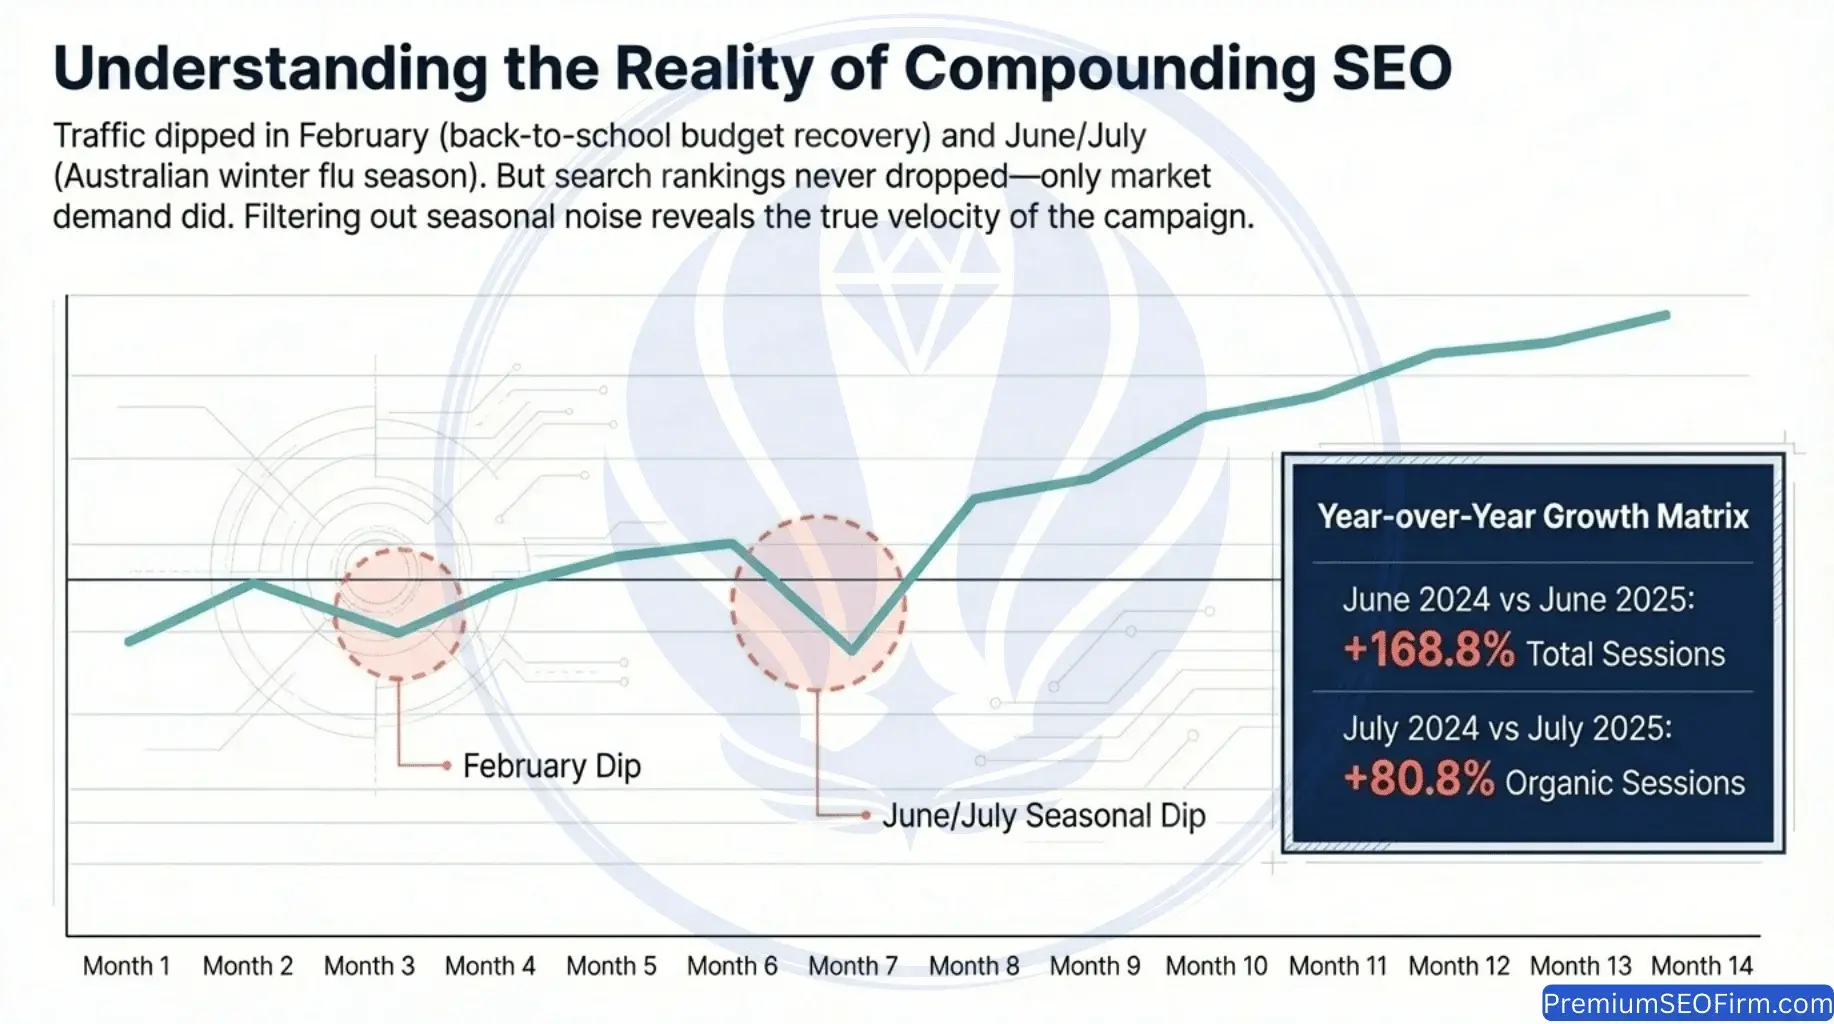
June 2025 recorded 414 total sessions and 349 organic sessions, a year-on-year increase of 168.8% in total traffic against June 2024’s 154 sessions, confirming genuine compounding growth after eliminating the seasonal variable. The table below compares June 2025 against June 2024 on a year-on-year basis across 5 metrics, providing the first direct seasonal comparison in the campaign.
| Metric | June 2025 | vs June 2024 Year-on-Year |
|---|---|---|
| Total Sessions | 414 | 154 vs 414 (+168.8%) |
| Organic Sessions | 349 | 138 vs 349 (+152.9%) |
| New Users | 320 | 112 vs 320 (+185.7%) |
| Booking Clicks | 36 | 21 vs 36 (+71.4%) |
| Google Traffic Share | 84.4% | 85.7% vs 84.4% |
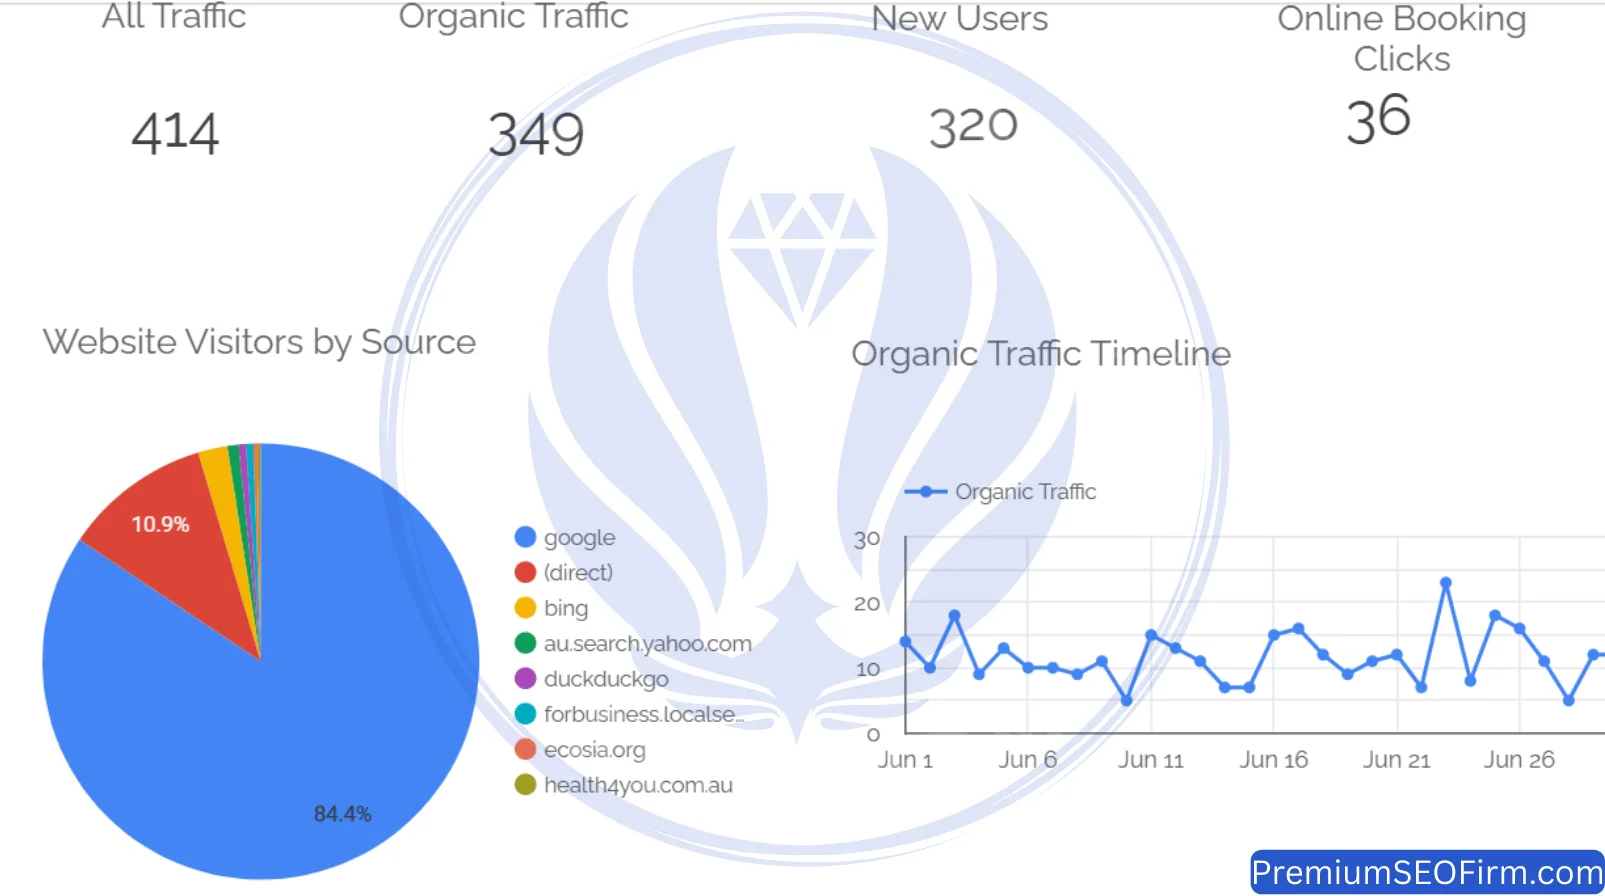
Year-on-year comparison eliminates the seasonal variable entirely. June 2025 landed lower than May 2025, the expected Australian winter pattern. The June 2025 to June 2024 comparison confirms the real growth trajectory: total traffic up 168.8%, organic sessions up 152.9%, new users up 185.7%, and booking clicks up 71.4%. The seasonal winter dip in June 2025 landed on a base nearly 3 times higher than where the campaign started 12 months earlier.
Why Did the Australian Winter Seasonal Pattern Reduce Traffic in June 2025?
Australian dental practices record consistent demand reductions for non-urgent appointments in June and July, driven by cold and flu season, school holiday disruptions, and mid-year budget contraction that suppress elective dental search volume industry-wide each year. This is a demand-side pattern, not a ranking problem. All first-page positions held through June without change, confirming the traffic reduction reflected lower patient search demand, not a competitive position loss that requires recovery work in subsequent months.
How Did the Orthodontics Page Internal Link Review Reinforce Position-1 Maintenance?
The June on-page work added 2 new internal links from blog articles covering clear aligner topics to the orthodontics Waterford treatment page, expanding topical relevance signals flowing to the page and reinforcing its position-1 ranking through the quieter winter period. The review first confirmed that all major relevant pages linked to the orthodontics page with topically matched anchor text. Internal link additions from topically relevant content pages to a commercial ranking page contribute authority flow that sustains position through periods of lower active optimisation work.
What Patient Intent Did the Month 13 Blog Article Target?
June’s blog article covered root canal procedures in patient-accessible language, addressing the 3 most common concerns patients research before deciding to book: the procedure process itself, the recovery timeline, and the pain management approach used in modern root canal treatment. Root canal treatment is among the highest-searched dental procedure topics in Australia because patient anxiety about the procedure is a documented barrier to booking. A well-structured informational article on this topic delivers high-intent research traffic from patients in active consideration, builds topical authority in the emergency and restorative dentistry content cluster, and provides internal link equity to the restorative treatment pages that target the same patient segment.
Month 14, July 2025: Second Year-Over-Year Confirmation and Campaign Close
What Were the Month 14 Traffic Results?
July 2025 recorded 453 total sessions and 387 organic sessions, a year-on-year increase of 73.6% in total traffic and 80.8% in organic sessions against July 2024’s figures, providing a second consecutive seasonal confirmation of real compounding growth. The table below compares July 2025 against July 2024 on a year-on-year basis across 5 metrics.
| Metric | July 2025 | vs July 2024 Year-on-Year |
|---|---|---|
| Total Sessions | 453 | 261 vs 453 (+73.6%) |
| Organic Sessions | 387 | 214 vs 387 (+80.8%) |
| New Users | 335 | 177 vs 335 (+89.3%) |
| Booking Clicks | 39 | 45 vs 39 |
| Google Traffic Share | 84.5% | 78.1% vs 84.5% (+6.4 points) |
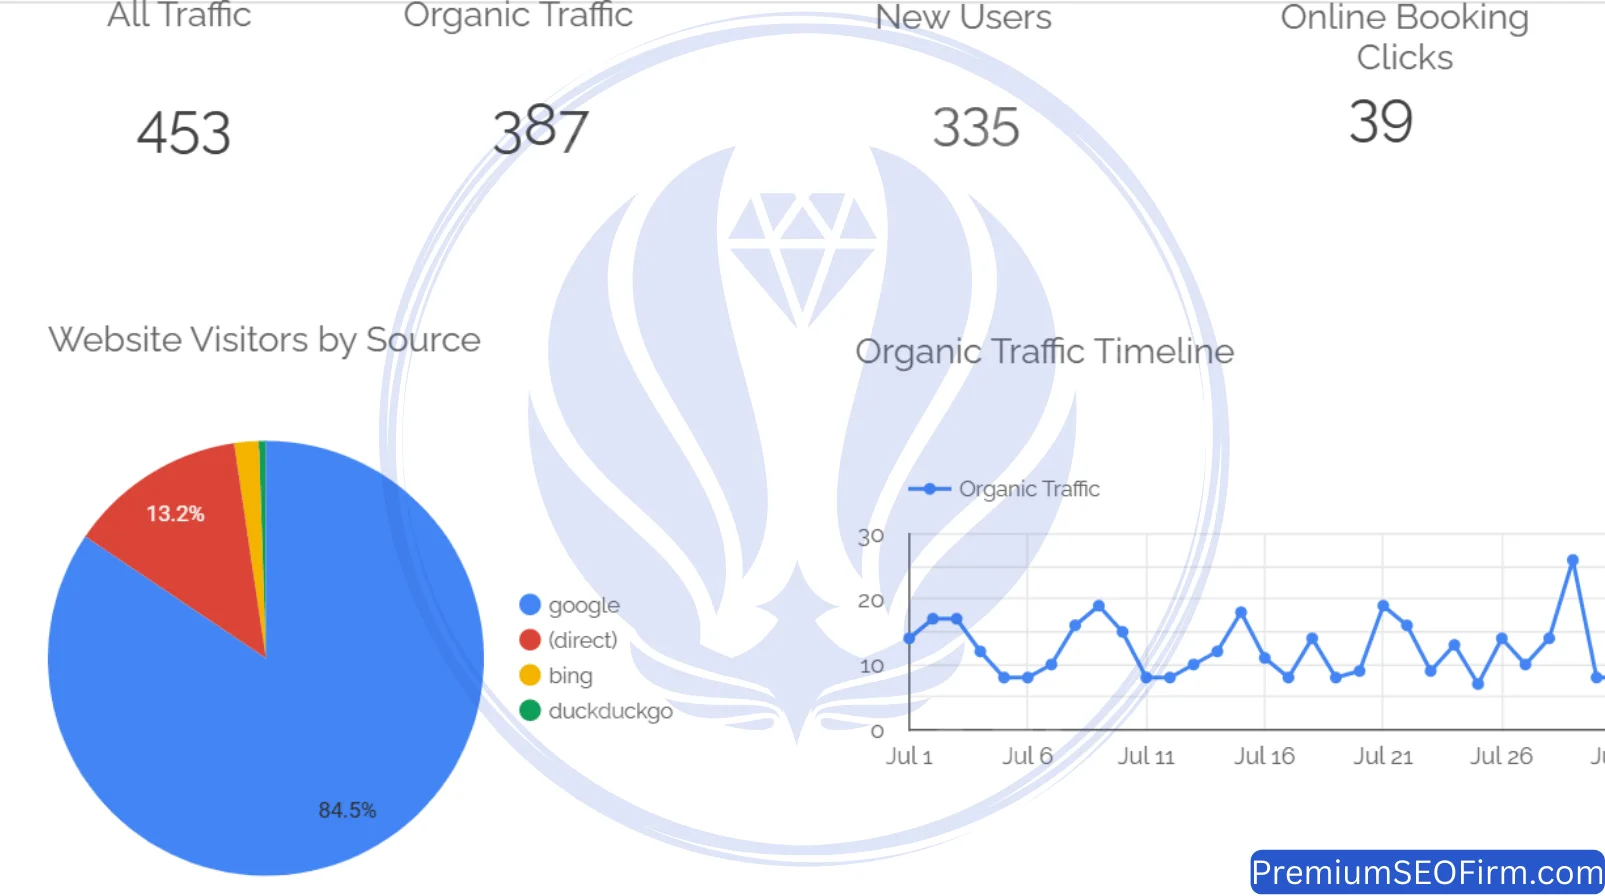
Google traffic share strengthened from 78.1% in July 2024 to 84.5% in July 2025, a 6.4 percentage-point increase confirming organic search became a more dominant and reliable patient acquisition channel across the 12-month period. The booking click comparison, 45 in July 2024 versus 39 in July 2025, reflects the difference between the post-holiday high-demand period of July 2024 and the mid-winter demand dip of July 2025. Rankings were unchanged. Demand followed the seasonal pattern.
What Did the July 2025 Looker Studio Traffic Spike Confirm?
The July 2025 Looker Studio organic traffic timeline showed a consistent daily organic visitor pattern across the month with a notable traffic spike in the final days of the reporting period. End-of-month spikes in dental search traffic are consistent with patients planning ahead for the following month’s appointments, searching, evaluating, and booking before August begins. The spike confirms the site reached patients at the active decision point of the booking process, not only the early research stage, confirming that organic visibility was converting at the commercial intent level.
How Did Schema Validation Error Resolution Maintain AI Platform Eligibility?
A LocalBusiness schema validation error identified on the main service page during the July technical audit cycle was resolved within the same reporting period, maintaining continuous structured data accuracy required for AI platform recommendation eligibility. Schema validation errors prevent structured data from being read correctly by Google’s structured data parser and by AI platforms that depend on the same schema signals. Catching and resolving these errors through monthly audit cycles maintains the technical condition required for AI platform recommendation eligibility and rich result eligibility in Google Search to remain active.
How Did the XML Sitemap Redirect Chain Audit Protect Crawl Budget?
The Ahrefs XML sitemap audit in July identified 301 redirect chains present in the sitemap’s URL entries, a configuration error directing Googlebot through redirect hops before reaching indexable content rather than pointing directly to final canonical destinations. Crawl budget is the total number of pages Google’s crawler Googlebot allocates to a domain each day. Sitemap URLs pointing to redirects waste crawl budget by directing Googlebot through redirect hops before reaching indexable content. All affected sitemap entries were updated to point directly to their canonical final URLs, ensuring Googlebot’s daily crawl allocation reached indexable pages rather than redirect sequences.
What Issues Did the SiteChecker Pro Monthly Audit Identify and Resolve in July?
The July SiteChecker Pro audit identified 4 categories of new issues introduced since the June rerun: deferred offscreen image loading gaps on newly added pages, duplicate HTML ID attributes introduced by a plugin update, images above 100 kilobytes on 2 new service page additions, and duplicate H1 elements on 2 pages where content had been updated without maintaining the single-H1 heading structure requirement. All 4 issue categories were resolved within the July reporting period. Both the Ahrefs site health score and the SiteChecker Pro score returned to 100 after remediation, maintaining the perfect technical audit baseline established in Month 4.
What Were the Final Keyword Rankings at Campaign Close?
The July 2025 ranking review confirmed 6 of 13 tracked keywords at position 1 and all 13 tracked keywords within the top 10 on Google, representing 100% first-page coverage at campaign close. The table below shows the Google position for each of the 13 tracked keywords at campaign close in July 2025.
| Target Keyword | Google Position — July 2025 |
|---|---|
| Waterford Dentist | Position 1 |
| Dentist Waterford | Position 1 |
| Teeth Whitening Waterford | Position 1 |
| Dental Implants Waterford | Position 1 |
| Orthodontics Waterford | Position 1 |
| Dentist Waterford West | Position 1 |
| Emergency Dentist Waterford | Position 2 |
| Dentist Bethania | Position 3 |
| Dentist Kingston | Position 4 |
| Dentist Edens Landing | Position 6 |
| Dentist Crestmead | Position 7 |
| Dentist Park Ridge | Position 8 |
| Dentist Marsden | Page one, continuing to climb |
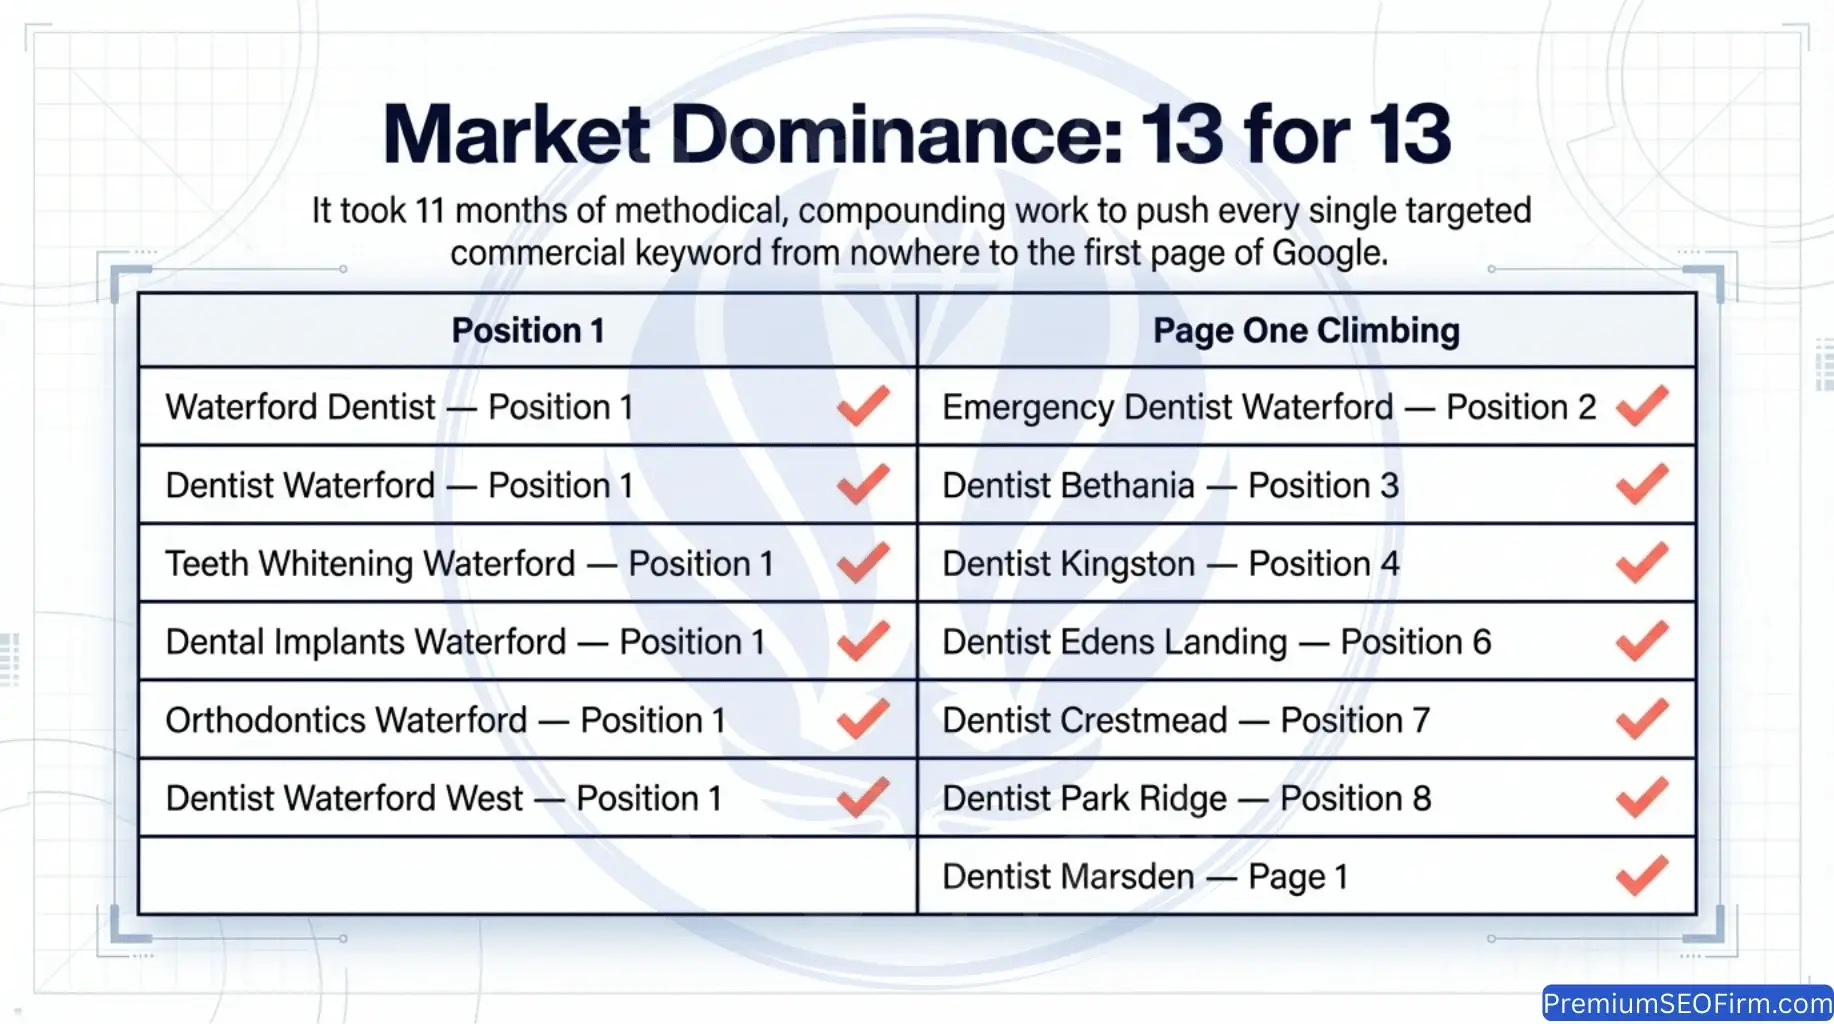
The practice entered June 2024 with 0 first-page rankings and closed July 2025 holding position 1 for its primary dentist keyword, 2 core treatment keywords, and 3 suburb keywords, a complete first-page presence across the full local keyword set it competed for in the Brisbane south dental market.
What Does the Full 14-Month Performance Data Confirm?
How Did Baseline Metrics Compare to Campaign Close?
The May 2024 baseline of 3 organic sessions per month grew to 387 organic sessions in July 2025, a 12,800% increase produced by 14 months of consistent, compounding work across 6 parallel streams. The table below shows the baseline figures from May 2024 against the final month results from July 2025, with the total growth percentage for each metric across the full campaign period.
| Metric | May 2024 Baseline | July 2025 Final Month | Total Growth |
|---|---|---|---|
| Total Sessions | 4 | 453 | +11,225% |
| Organic Sessions | 3 | 387 | +12,800% |
| New Users | 3 | 335 | +11,066% |
| Booking Clicks | 0 | 39 | From zero to active |
| Page-One Keywords | 0 | 13 of 13 | 100% first-page coverage |
The growth figures confirm that Google and AI platforms now recognise this practice as the authoritative local dental resource for Waterford, Queensland and its surrounding suburbs. That recognition is the direct, measurable output of 14 months of technical precision, content depth, citation authority, and on-page optimisation operating together at scale.
What Does the Complete Month-by-Month Traffic Reference Show?
The complete month-by-month traffic reference records every data point across all 5 primary metrics for the full 14-month campaign, confirming 4,812 total sessions, 3,954 organic sessions, 3,414 new users, and 503 booking clicks from a pre-campaign baseline of 0 booking clicks and 3 organic sessions per month. The table below includes the May 2024 baseline and the 14-month campaign totals in the final row.
| Month | All Sessions | Organic | New Users | Bookings | Google % |
|---|---|---|---|---|---|
| May 2024 (Baseline) | 4 | 3 | 3 | 0 | 75% |
| June 2024, M1 | 154 | 138 | 112 | 21 | 85.7% |
| July 2024, M2 | 261 | 214 | 177 | 45 | 78.1% |
| August 2024, M3 | 261 | 207 | 179 | 36 | 79.8% |
| September 2024, M4 | 283 | 247 | 197 | 36 | 79.5% |
| October 2024, M5 | 320 | 257 | 209 | 45 | 77.4% |
| November 2024, M6 | 300 | 243 | 200 | 38 | 77% |
| December 2024, M7 | 347 | 294 | 251 | 33 | 85.4% |
| January 2025, M8 | 421 | 326 | 282 | 51 | 78.8% |
| February 2025, M9 | 354 | 285 | 235 | 33 | 79.7% |
| March 2025, M10 | 366 | 308 | 271 | 29 | 85.2% |
| April 2025, M11 | 410 | 330 | 282 | 43 | 80.3% |
| May 2025, M12 | 505 | 411 | 364 | 38 | 81.6% |
| June 2025, M13 | 414 | 349 | 320 | 36 | 84.4% |
| July 2025, M14 | 453 | 387 | 335 | 39 | 84.5% |
| 14-Month Total | 4,812 | 3,954 | 3,414 | 503 | 81.4% avg |
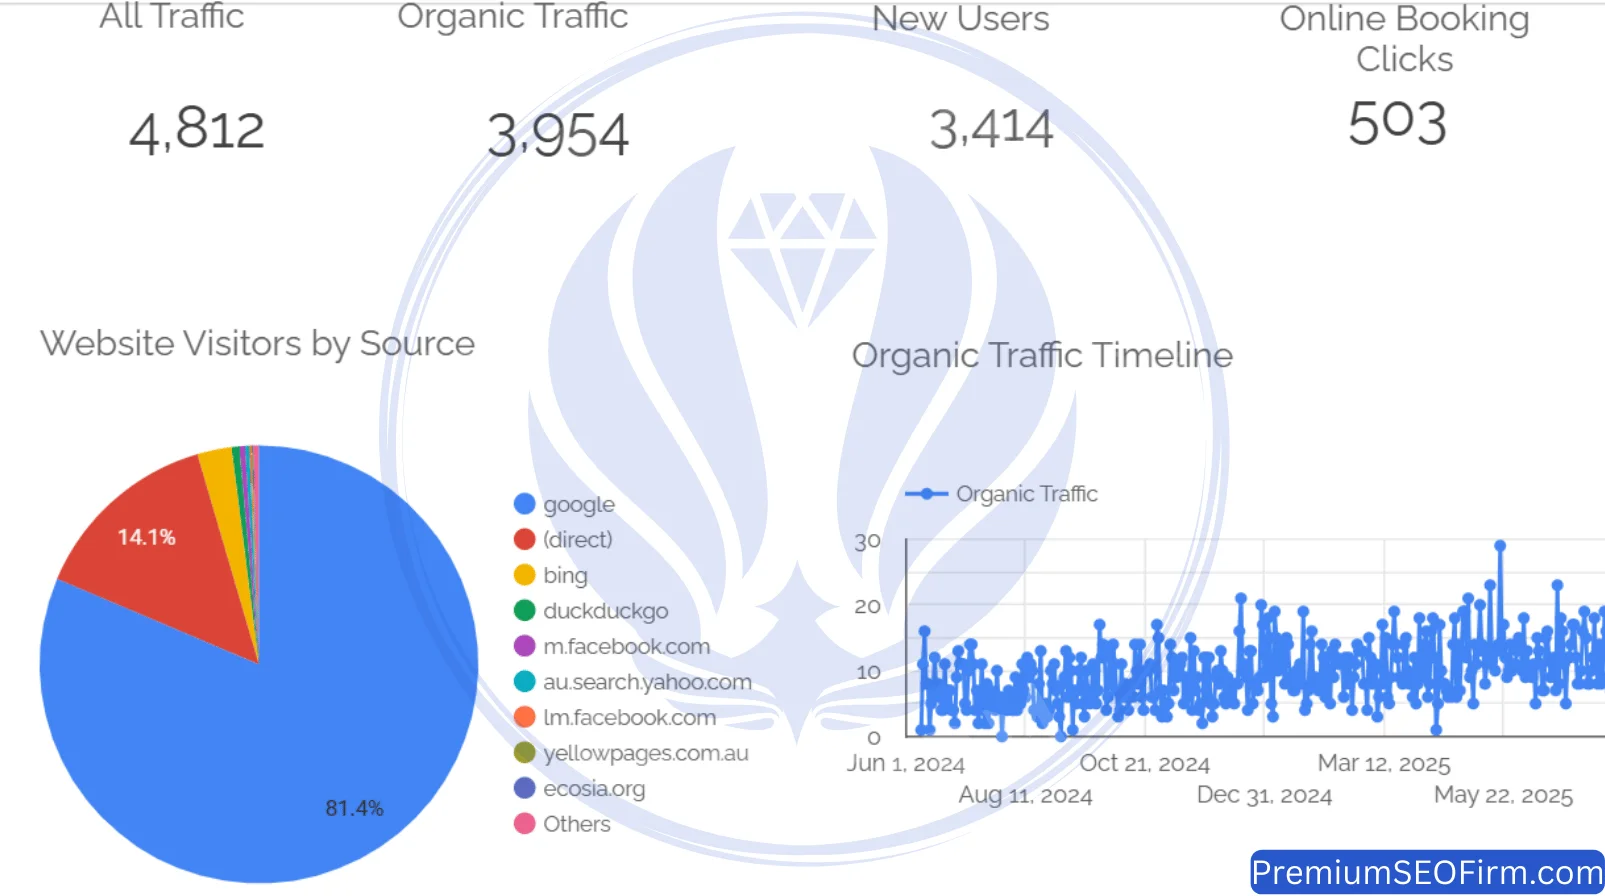
The 81.4% average Google traffic share across the full campaign confirms organic search as the dominant and consistent patient acquisition channel throughout all 14 months. The 503 total booking clicks represent 503 patients who found the practice through search, arrived at the website, evaluated the practice’s services, and took the specific action of clicking to book an appointment from a pre-campaign baseline of zero.
How Did Quarterly Performance Progress Across the 4 Campaign Quarters?
Every campaign quarter produced more total sessions than the quarter before, with Q1 recording 676 sessions, Q2 recording 903, Q3 recording 1,122, and Q4 recording 1,281 across their respective 3-month periods. The table below shows performance across all 4 campaign quarters with quarter-on-quarter growth percentages documenting the compounding trajectory from Q1 to Q4.
| Quarter | Period | All Sessions | Organic | New Users | Bookings |
|---|---|---|---|---|---|
| Q1 | Jun to Aug 2024 | 676 | 559 | 468 | 102 |
| Q2 | Sep to Nov 2024 | 903 (+33.6%) | 747 (+33.6%) | 606 (+29.5%) | 119 (+16.7%) |
| Q3 | Dec 2024 to Feb 2025 | 1,122 (+24.3%) | 905 (+21.2%) | 768 (+26.7%) | 117 |
| Q4 | Mar to May 2025 | 1,281 (+14.2%) | 1,049 (+15.9%) | 917 (+19.4%) | 110 |
| Q1 to Q4 Growth | 9 months | +89.5% | +87.7% | +95.9% | +7.8% |
The quarter-on-quarter growth rate slowed as the campaign matured, which is the normal pattern in compounding SEO growth where absolute gains continue rising as the percentage rate of increase moderates. The absolute session numbers kept rising because all first-page rankings held and the content programme continued expanding topical authority across each quarter.
How Did the Second Half of the Campaign Outperform the First?
The second half of the campaign (December 2024 to May 2025) produced 52.2% more total sessions and 49.6% more organic sessions than the first half (June to November 2024) from the same market without increasing the monthly budget. The table below compares H1 against H2 across 4 metrics, showing the performance differential between the 2 halves of the core campaign year.
| Half | Period | All Sessions | Organic | New Users | Bookings |
|---|---|---|---|---|---|
| H1 | Jun to Nov 2024 | 1,579 | 1,306 | 1,074 | 221 |
| H2 | Dec 2024 to May 2025 | 2,403 (+52.2%) | 1,954 (+49.6%) | 1,685 (+56.9%) | 227 (+2.7%) |
The H1-to-H2 performance differential is the measurable output of compounding: 6 months of additional technical maintenance, content depth, ranking maturity, and citation authority operating on top of the H1 foundation. The same work streams running for a longer period produced proportionally greater returns, confirming the compounding mechanism that separates organic SEO from campaigns where results are tied directly to spend.
When Did Each AI Platform First Confirm Referral Traffic?
ChatGPT (OpenAI) confirmed as a referral source in Month 10 (March 2025) and Google Gemini (Google DeepMind) confirmed as a second referral source in Month 11 (April 2025), both appearing in consecutive months without any dedicated AI optimisation workstream running in the campaign. The table below records the 2 AI platform referral sources that confirmed during the campaign, showing when each first appeared and what technical foundations produced the visibility.
| AI Platform | First Confirmed Referral Traffic | How It Was Built |
|---|---|---|
| ChatGPT (OpenAI) | Month 10 — March 2025 | Schema markup from Month 2, citation signals from Month 1, content depth from Month 3 |
| Google Gemini (Google DeepMind) | Month 11 — April 2025 | Same structured data and entity signals used for Google organic rankings |
The AI referral traffic was the direct output of the schema depth, citation consistency, and content quality standards that formed the standard SEO programme from Month 1. ChatGPT (OpenAI), Google Gemini (Google DeepMind), Grok (xAI), and Claude (Anthropic) all evaluate the same structured data signals, entity consistency, and content quality indicators that Google’s organic ranking algorithm evaluates. A dental practice investing in good SEO today builds AI search visibility simultaneously, from the same foundations, without a separate programme.
What Does This 14-Month Dental SEO Case Study Confirm for Any Practice Considering Organic Growth?
Why Did Growth Compound Rather Than Spike?
The 12,800% organic traffic growth documented in this 14-month dental SEO case study accumulated across 14 consecutive months of consistent work, not a single breakthrough month or a single tactic. Q1 produced 676 sessions. Q2 produced 903. Q3 produced 1,122. Q4 produced 1,281. Each quarter built on a stronger foundation than the quarter before because the 6-stream campaign architecture compounded. Technical cleanliness, content authority, citation depth, and ranking maturity all reinforce each other when run in parallel. The same monthly work produced proportionally greater returns in Month 12 than in Month 1 because the foundation it operated on was 12 months stronger.
How Did Algorithm Updates Reward Proper Foundations?
3 major Google Core Updates rolled through this campaign (the August 2024, November 2024, and March 2025 Core Updates), and the site grew through 2 of them and held steady through the third, losing no first-page ranking across any of the 3 rollout periods. Sites built on private blog networks, keyword stuffing, or thin content lose rankings during core updates because those updates are designed to identify and correct for exactly those shortcuts. This site held because clean technical infrastructure, genuinely useful patient content, and a spam-free link profile gave the updates nothing to penalise. White hat SEO practices are not only an ethical standard. White hat SEO practices are the practical condition required for rankings to survive the quality assessments that algorithm updates execute at scale.
How Does Good SEO Build AI Visibility Without a Separate AI Programme?
ChatGPT (OpenAI) and Google Gemini (Google DeepMind) both confirmed as referral traffic sources in Months 10 and 11 without any dedicated AI optimisation work running in the campaign. The structured data deployed from Month 1, the citation consistency built from Month 2, and the content depth programme running from Month 3 collectively crossed the entity signal threshold required for AI platform recommendation eligibility by Month 10. AI platforms use the same signals Google uses. A dental practice investing in technically precise, content-rich, entity-complete SEO today builds its AI search presence simultaneously, not as a future project, but as the automatic byproduct of doing standard SEO correctly from the beginning.
What Do 503 Booking Clicks Confirm About Commercial ROI?
503 total online booking clicks across 14 months, starting from a pre-campaign baseline of 0, is the commercial output of this dental SEO campaign in its most direct measurable form. Each of the 503 booking clicks is a patient who found the practice through search, arrived at the website, evaluated the practice’s services, and took the specific action of clicking to book an appointment. The website contributed 0 booking clicks before the campaign began. The difference between 0 and 503 is what technically precise, consistently executed, compounding dental SEO produces when given sufficient time and built on proper foundations from the first month.
All session totals, organic traffic figures, new user counts, booking click numbers, and Google traffic share percentages referenced in this case study are sourced directly from the Google Analytics Looker Studio monthly reports and the complete 14-month campaign view, covering June 2024 through July 2025.